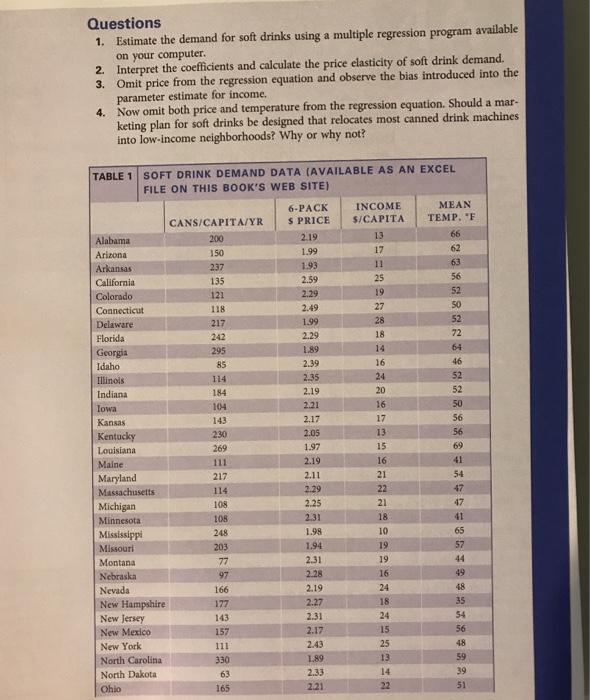
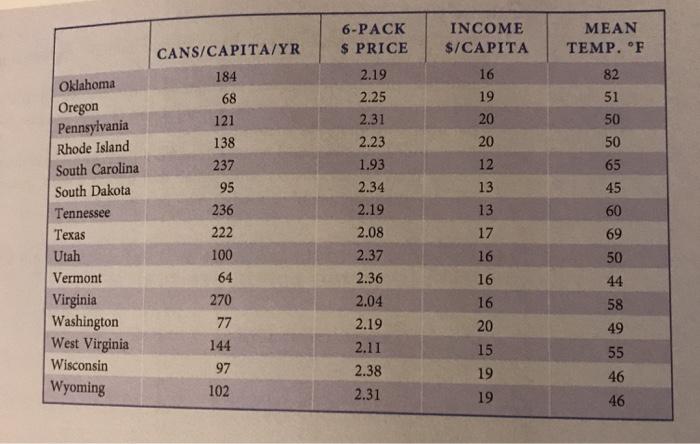
Question: Questions 1. Estimate the demand for soft drinks using a multiple regression program available on your computer. 2. Interpret the coefficients and calculate the price

Questions 1. Estimate the demand for soft drinks
Questions 1. Estimate the demand for soft drinks using a multiple regression program available on your computer. 2. Interpret the coefficients and calculate the price elasticity of soft drink demand. 3. Omit price from the regression equation and observe the bias introduced into the parameter estimate for income. 4. Now omit both price and temperature from the regression equation. Should a mar- keting plan for soft drinks be designed that relocates most canned drink machines into low-income neighborhoods? Why or why not? TABLE 1 SOFT DRINK DEMAND DATA (AVAILABLE AS AN EXCEL FILE ON THIS BOOK'S WEB SITE) MEAN TEMP. "T 66 62 CANS/CAPITA/YR 200 150 237 135 121 118 217 242 INCOME S/CAPITA 13 17 11 25 19 27 28 18 14 16 295 85 114 184 104 143 230 56 52 50 52 72 61 46 52 52 50 56 56 69 369 6-PACK S PRICE 2.19 1.99 1.93 2.59 2.29 2.49 1.99 2.29 1.89 2.39 2.35 2.19 2.21 2.17 2.05 1.97 2.19 2.11 2.29 2.25 2.31 1.98 1.94 2.31 2.28 2.19 2.27 2.31 2.17 2.43 1.89 2.33 2.21 Alabama Arizona Arkansas California Colorado Connecticut Delaware Florida Georgia Idaho Illinois Indiana Iowa Kansas Kentucky Louisiana Maine Maryland Massachusetts Michigan Minnesota Mississippi Missouri Montana Nebraska Nevada New Hampshire New Jersey New Mexico New York North Carolina North Dakota Ohio 41 20 16 17 13 15 16 21 22 21 18 10 19 111 217 114 108 105 248 203 77 97 166 54 47 47 19 16 24 41 65 57 44 49 48 35 54 56 48 59 127 143 157 111 18 24 15 25 13 14 22 330 63 165 39 51 INCOME $/CAPITA 16 19 20 20 12 13 Oklahoma Oregon Pennsylvania Rhode Island South Carolina South Dakota Tennessee Texas Utah Vermont Virginia Washington West Virginia Wisconsin Wyoming CANS/CAPITA/YR 184 68 121 138 237 95 236 222 100 64 270 77 144 97 102 6-PACK $ PRICE 2.19 2.25 2.31 2.23 1.93 2.34 2.19 2.08 2.37 2.36 2.04 2.19 2.11 2.38 2.31 13 17 16 16 16 20 15 MEAN TEMP. F 82 51 50 50 65 45 60 69 50 44 58 49 55 46 46 19 19

Step by Step Solution

There are 3 Steps involved in it

1 Expert Approved Answer
Step: 1 Unlock blur-text-image
Question Has Been Solved by an Expert!

Get step-by-step solutions from verified subject matter experts

Step: 2 Unlock
Step: 3 Unlock

Students Have Also Explored These Related General Management Questions!