

Question: Questions: 1. Identify possible data patterns in the historical data (inventory cases, 2010-2014). Draw the data plot using Excel. That will help you to see
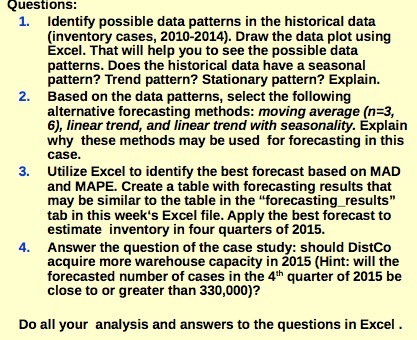
Questions: 1. Identify possible data patterns in the historical data (inventory cases, 2010-2014). Draw the data plot using Excel. That will help you to see the possible data patterns. Does the historical data have a seasonal pattern? Trend pattern? Stationary pattern? Explain. 2. Based on the data patterns, select the following alternative forecasting methods: moving average (n=3, 6), linear trend, and linear trend with seasonality. Explain why these methods may be used for forecasting in this case. 3. Utilize Excel to identify the best forecast based on MAD and MAPE. Create a table with forecasting results that may be similar to the table in the "forecasting_results" tab in this week's Excel file. Apply the best forecast to estimate inventory in four quarters of 2015. 4. Answer the question of the case study: should DistCo acquire more warehouse capacity in 2015 (Hint: will the forecasted number of cases in the 4th quarter of 2015 be close to or greater than 330,000)? Do all your analysis and answers to the questions in Excel
Step by Step Solution
There are 3 Steps involved in it

Get step-by-step solutions from verified subject matter experts