

Question: QUESTIONS: 1. Use the information to develop a cash flow analysis in the table above 2. Why do the net cash flows for April and
| QUESTIONS:
|
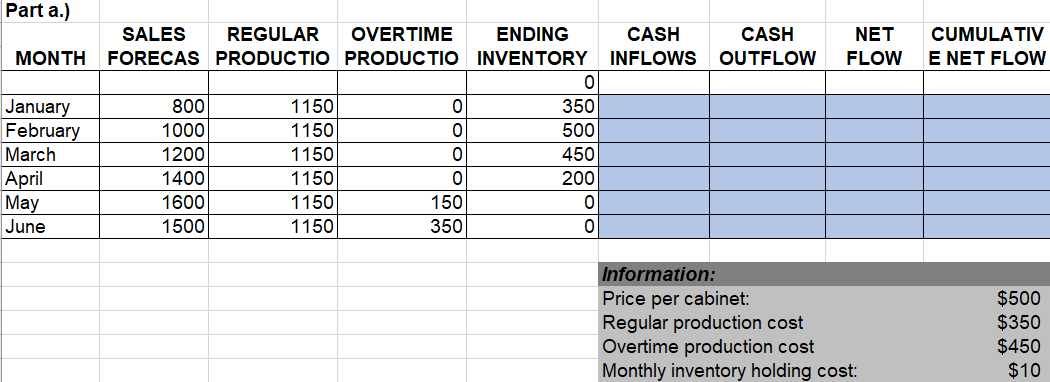
| 1. Use the information to develop a cash flow analysis in the table above |
| 2. Why do the net cash flows for April and May look so much better than those for the other months? What are the consequences for building up and draining down inventories under a level production plan? |
Step by Step Solution
There are 3 Steps involved in it
1 Expert Approved Answer
Step: 1 Unlock

Question Has Been Solved by an Expert!
Get step-by-step solutions from verified subject matter experts
Step: 2 Unlock
Step: 3 Unlock