

Question: Questions 18-22. This table again. The contingency table below contains data collected on undergraduate students at a particular college to determine the relationship between year
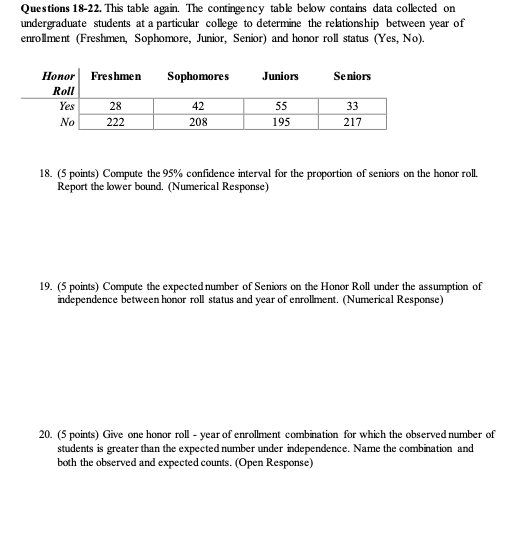

Questions 18-22. This table again. The contingency table below contains data collected on undergraduate students at a particular college to determine the relationship between year of enrollment (Freshmen, Sophomore, Junior, Senior) and honor roll status (Yes, No). Honor Freshmen Sophomores Juniors Seniors Roll Yes 28 42 55 33 No 222 208 195 217 18. (5 points) Compute the 95% confidence interval for the proportion of seniors on the honor roll. Report the lower bound. (Numerical Response) 19. (5 points) Compute the expected number of Seniors on the Honor Roll under the assumption of independence between honor roll status and year of enrollment. (Numerical Response) 20. (5 points) Give one honor roll - year of enrollment combination for which the observed number of students is greater than the expected number under independence. Name the combination and both the observed and expected counts. (Open Response)
Step by Step Solution
There are 3 Steps involved in it

Get step-by-step solutions from verified subject matter experts