

Question: Questions 9,10, and 11 are from applied calc 2. These problems were assigned on web assign. Thanks In 2010 a particular factory produced computer hard
Questions 9,10, and 11 are from applied calc 2. These problems were assigned on web assign. Thanks
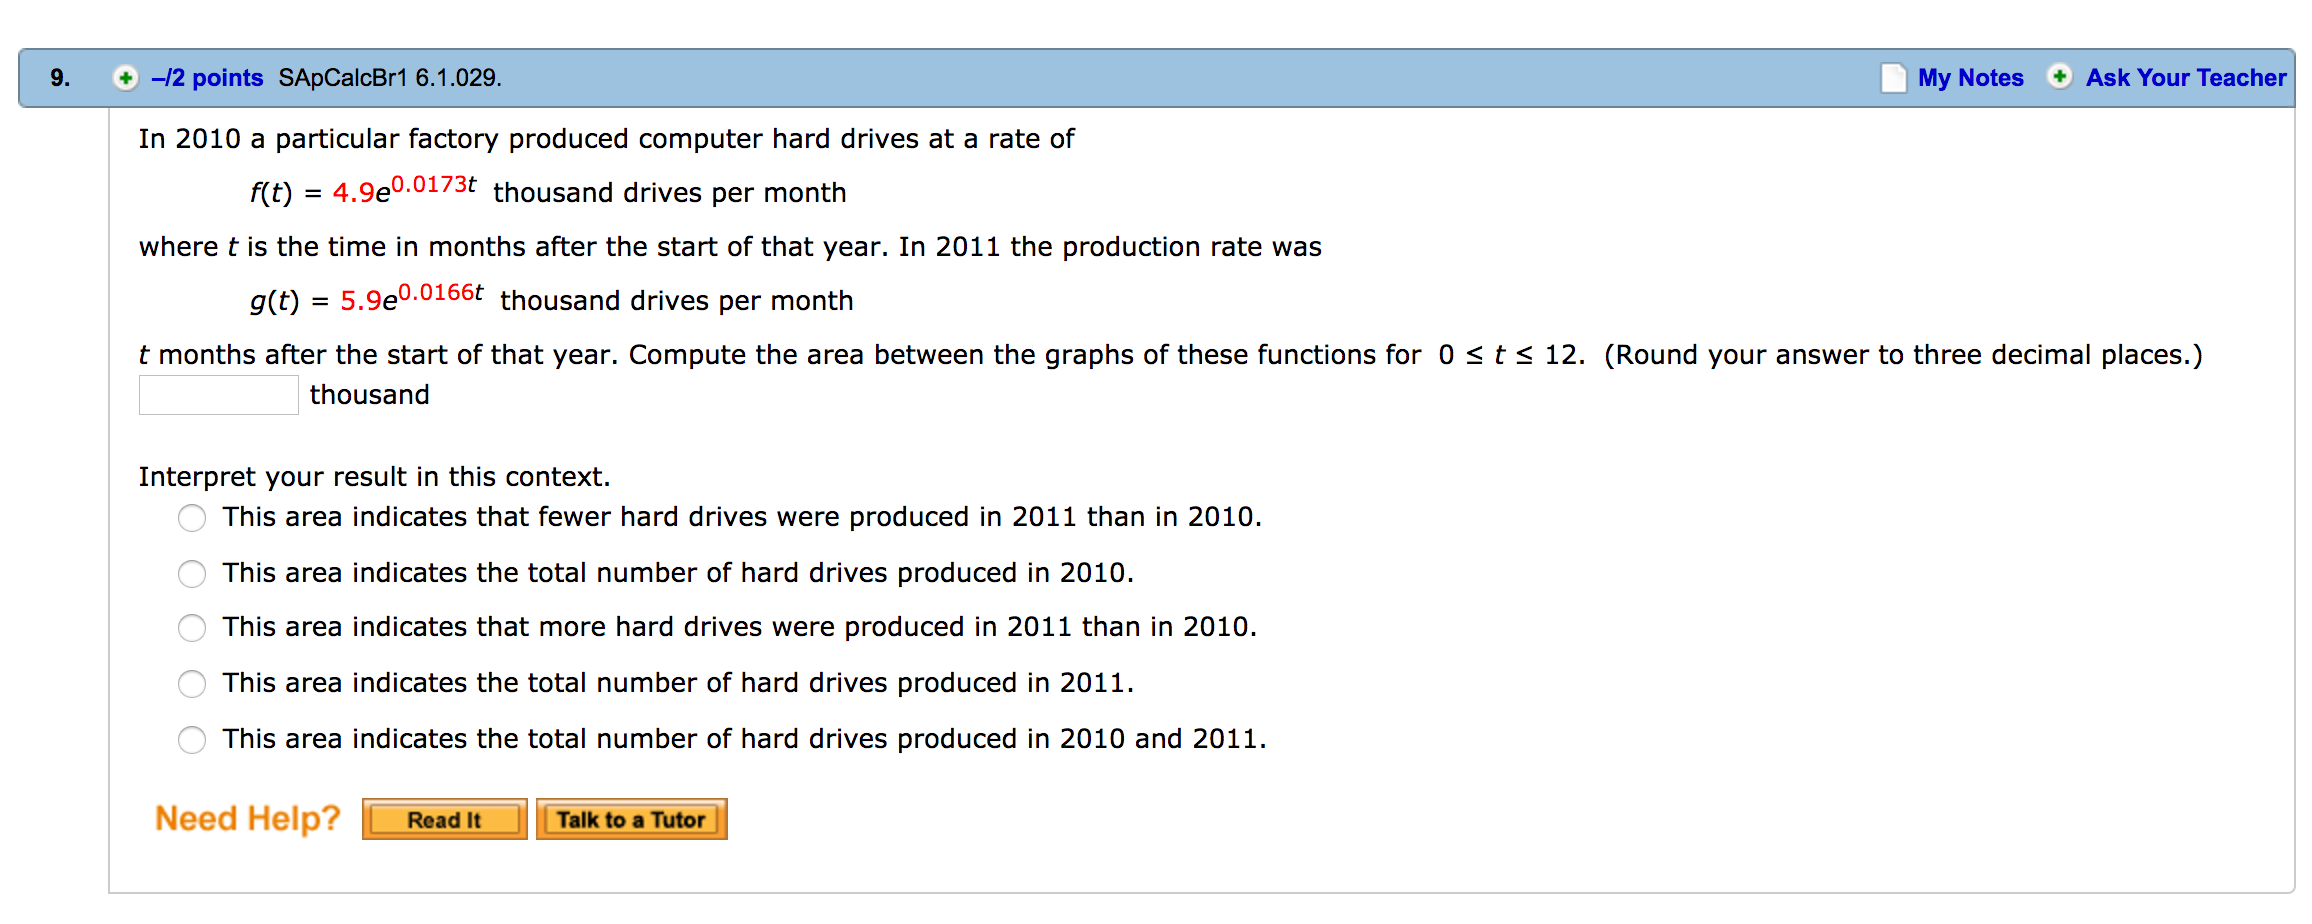
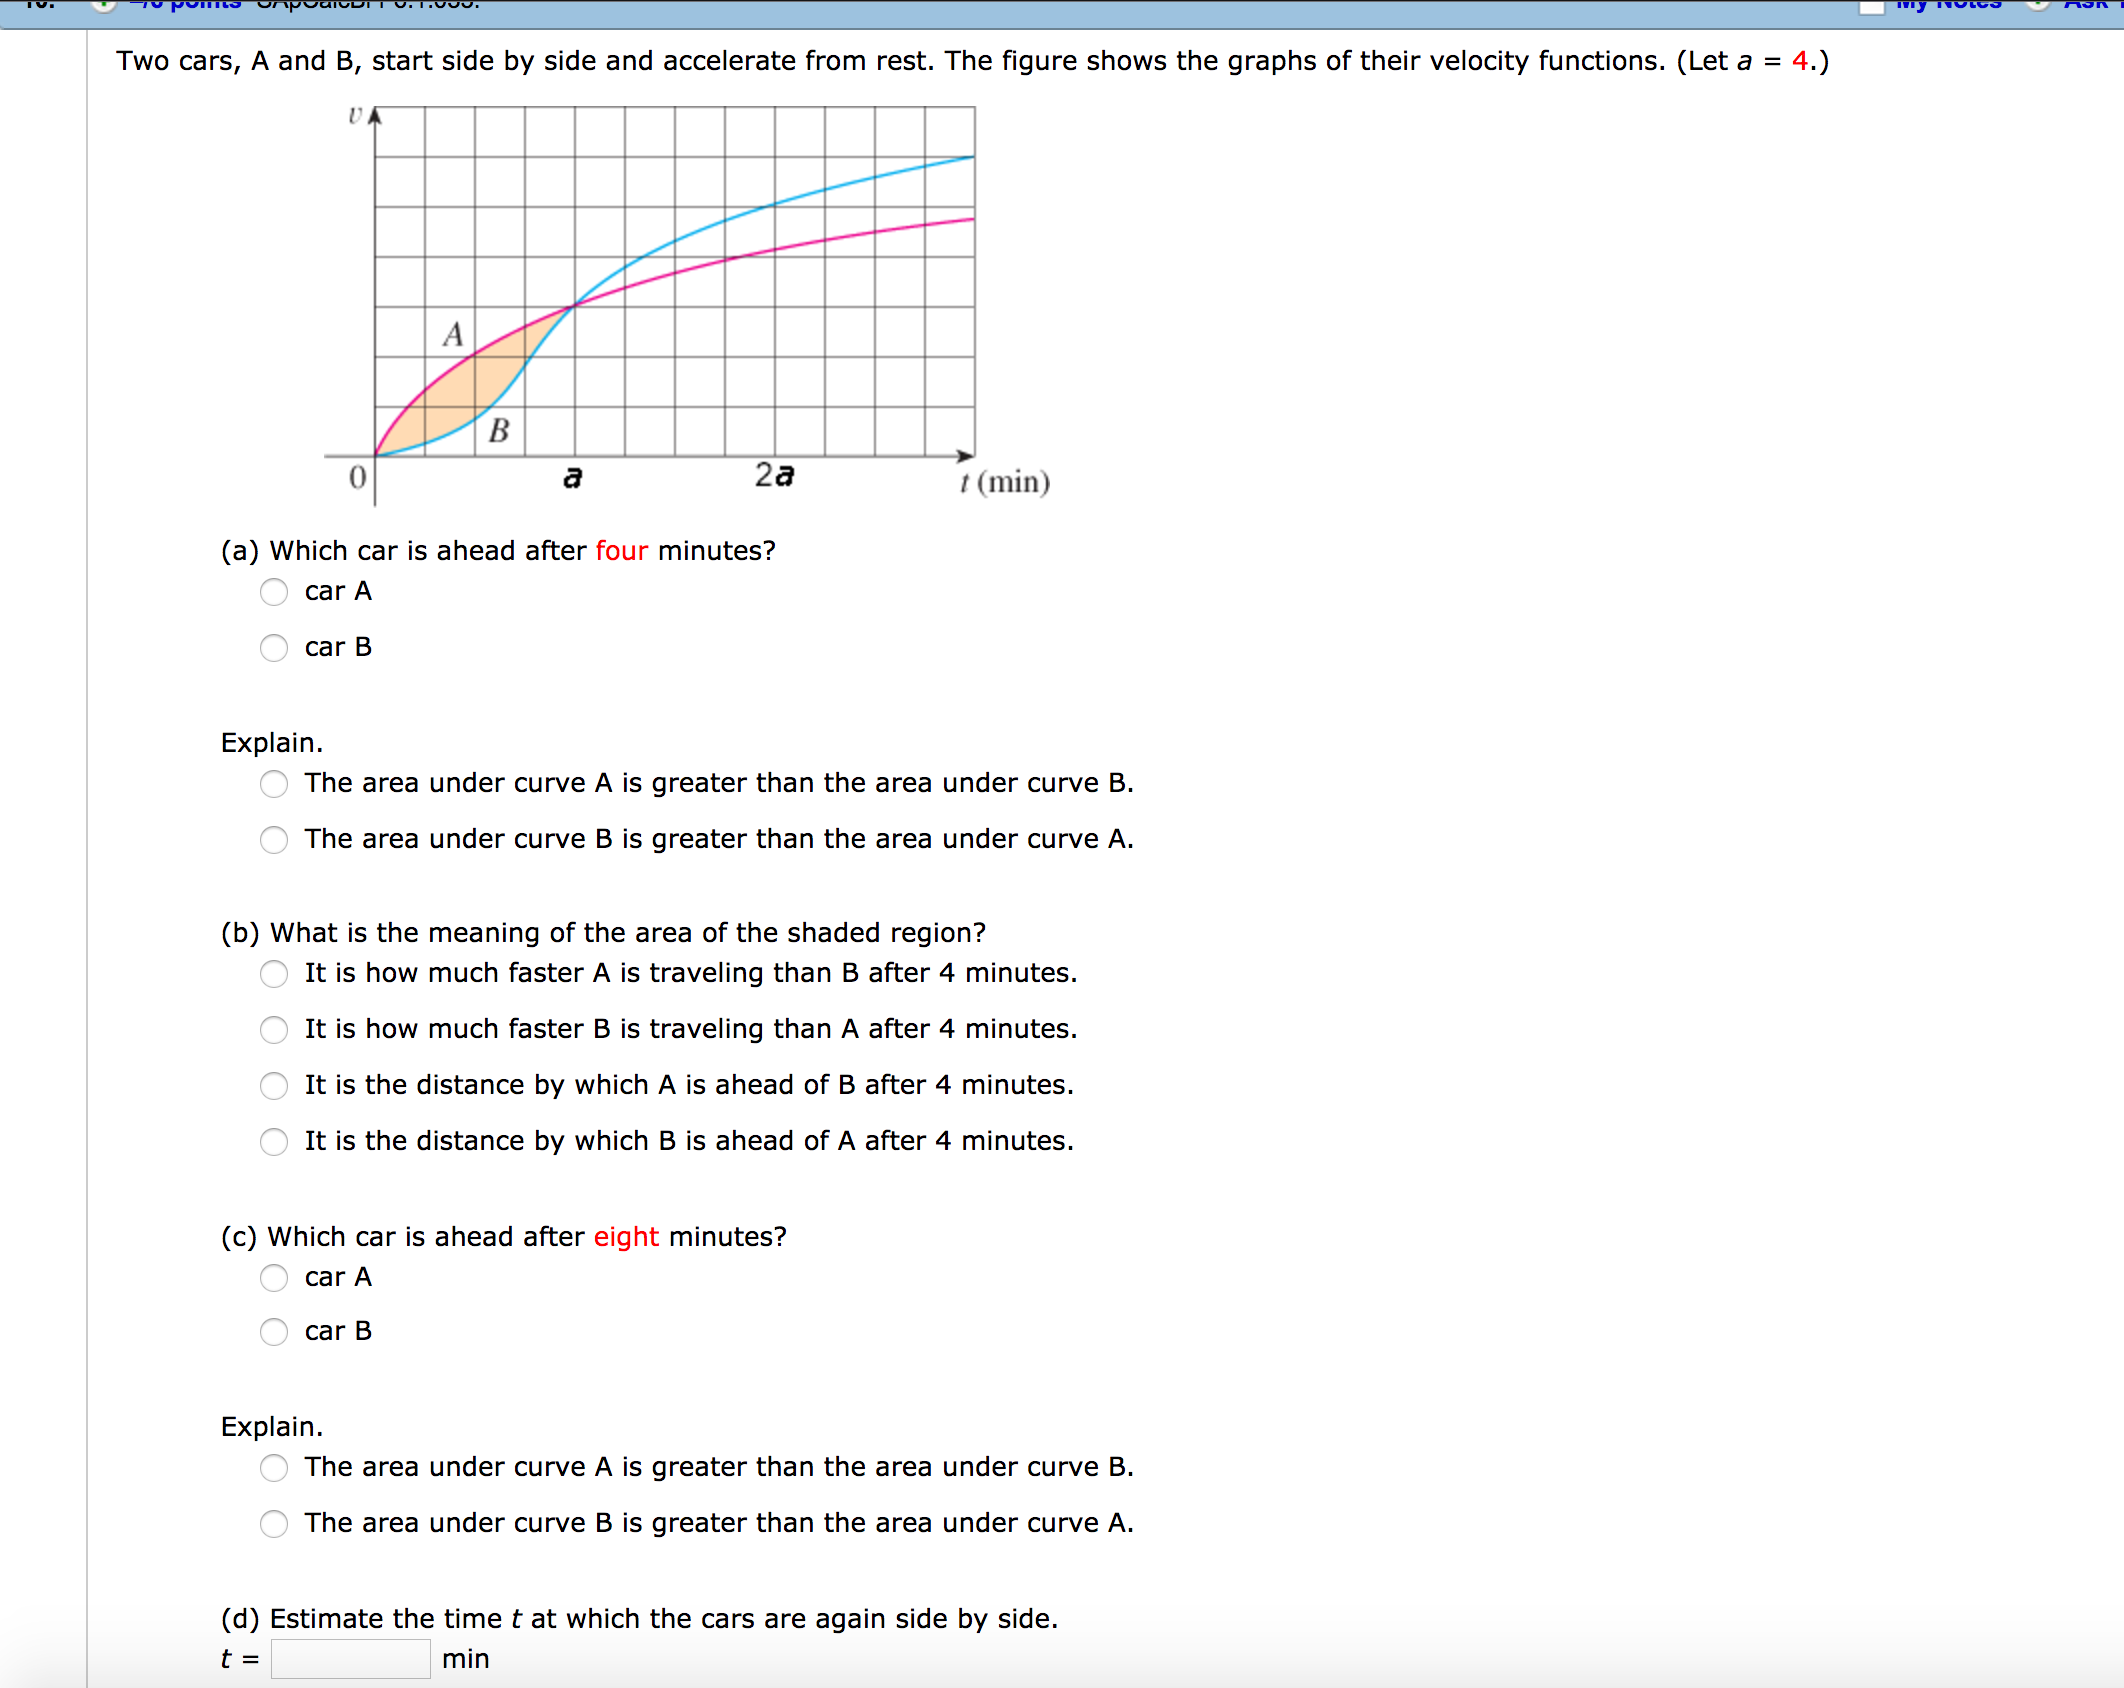
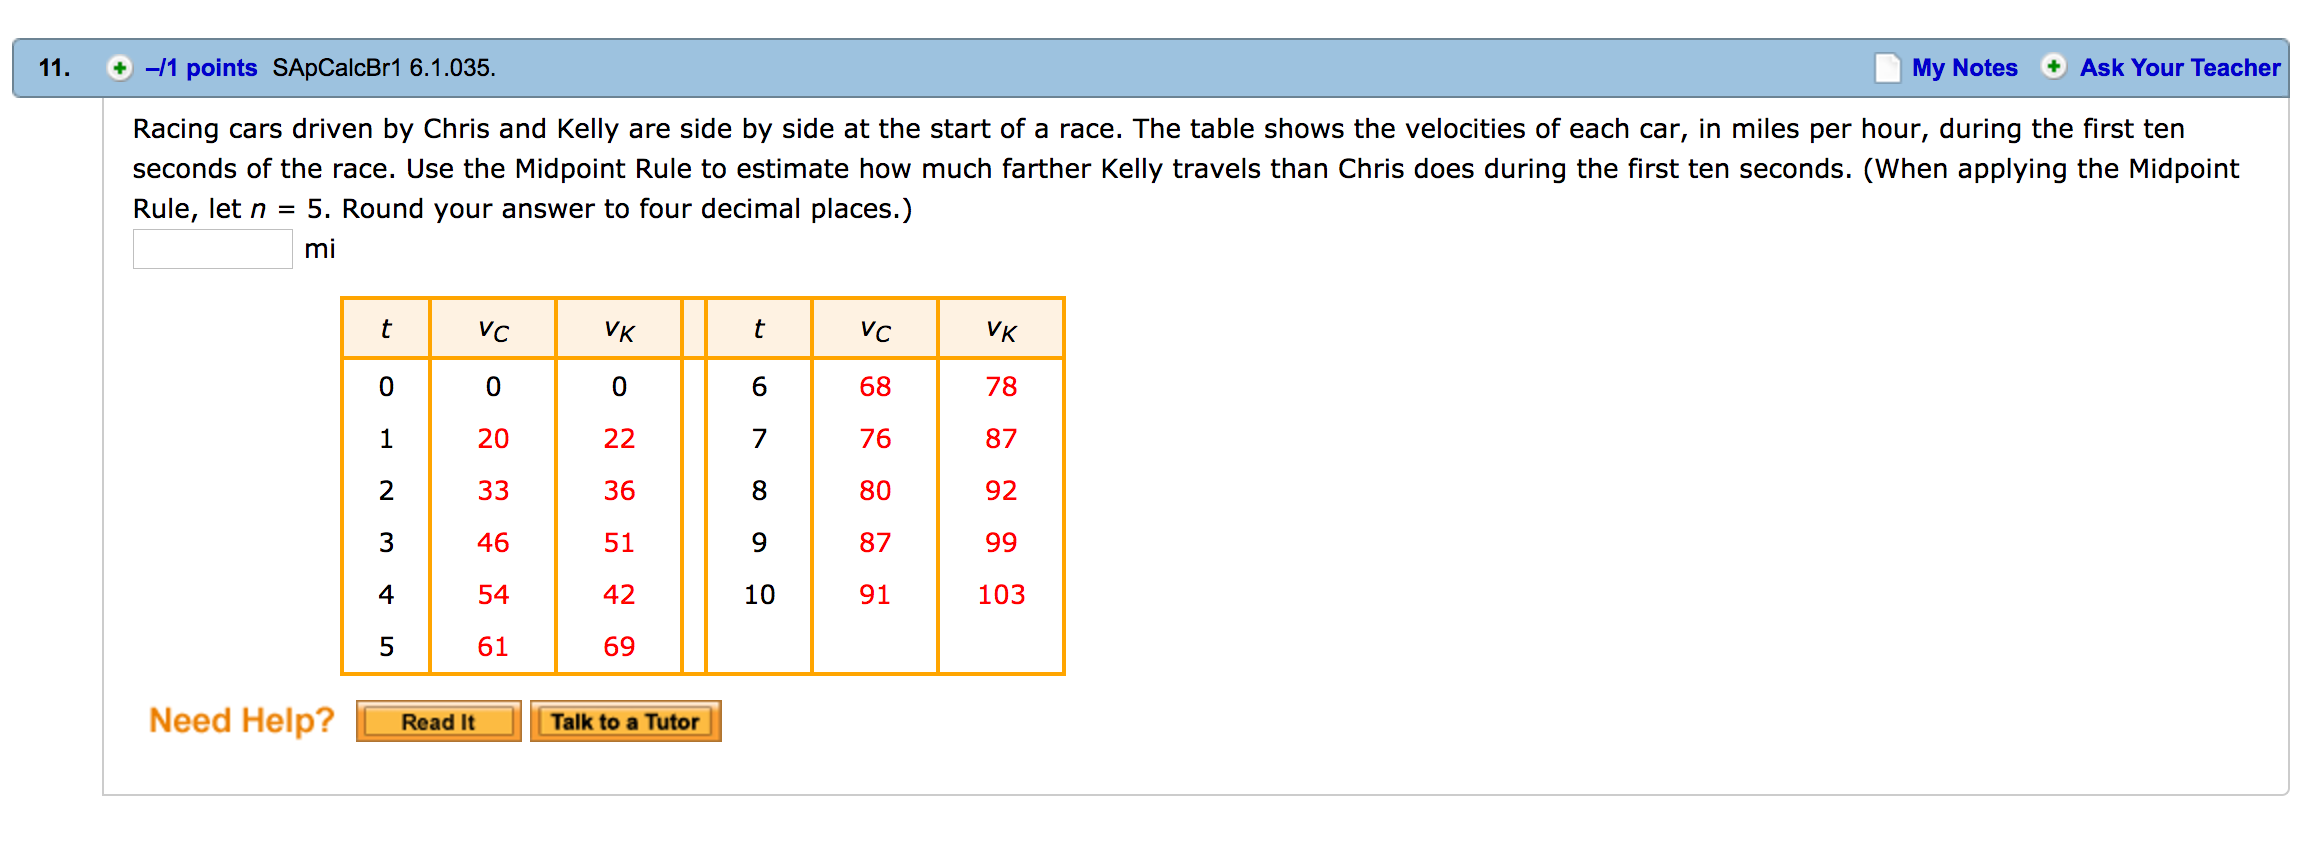
In 2010 a particular factory produced computer hard drives at a rate of f(t) = 4.9e-173' thousand drives per month where t is the time in months after the start of that year. In 2011 the production rate was g(t) = 5.9e0-0156t thousand drives per month t months after the start of that year. Compute the area between the graphs of these functions for 0 s t s 12. (Round your answer to three decimal places.) thousand Interpret your result in this context. O This area indicates that fewer hard drives were produced in 2011 than in 2010. O This area indicates the total number of hard drives produced in 2010. O This area indicates that more hard drives were produced in 2011 than in 2010. O This area indicates the total number of hard drives produced in 2011. O This area indicates the total number of hard drives produced in 2010 and 2011. Need Help? ii Two cars, A and B, start side by side and accelerate from rest. The gure shows the graphs of their velocity functions. (Let a = 4.) (a) Which car is ahead after four minutes? 0 carA O carB Explain. O The area under curve A is greater than the area under curve B. O The area under curve B is greater than the area under curve A. (b) What is the meaning of the area of the shaded region? Q It is how much faster A is traveling than B after 4 minutes. 0 It is how much faster B is traveling than A after 4 minutes. 0 It is the distance by which A is ahead of B after 4 minutes. 0 It is the distance by which B is ahead of A after 4 minutes. (c) Which car is ahead after eight minutes? 0 carA O carB Explain. O The area under curve A is greater than the area under curve B. Q The area under curve B is greater than the area under curve A. (d) Estimate the time t at which the cars are again side by side. t = min Racing cars driven by Chris and Kelly are side by side at the start of a race. The table shows the velocities of each car, in miles per hour, during the rst ten seconds of the race. Use the Midpoint Rule to estimate how much farther Kelly travels than Chris does during the rst ten seconds. (When applying the Midpoint Rule, let n = 5. Round your answer to four decimal places.)
Step by Step Solution
There are 3 Steps involved in it

Get step-by-step solutions from verified subject matter experts