

Question: Questions Analyze current Data and create full detailed Powerpoint with below requesta Point out top 4 concern areas that you can spot from the
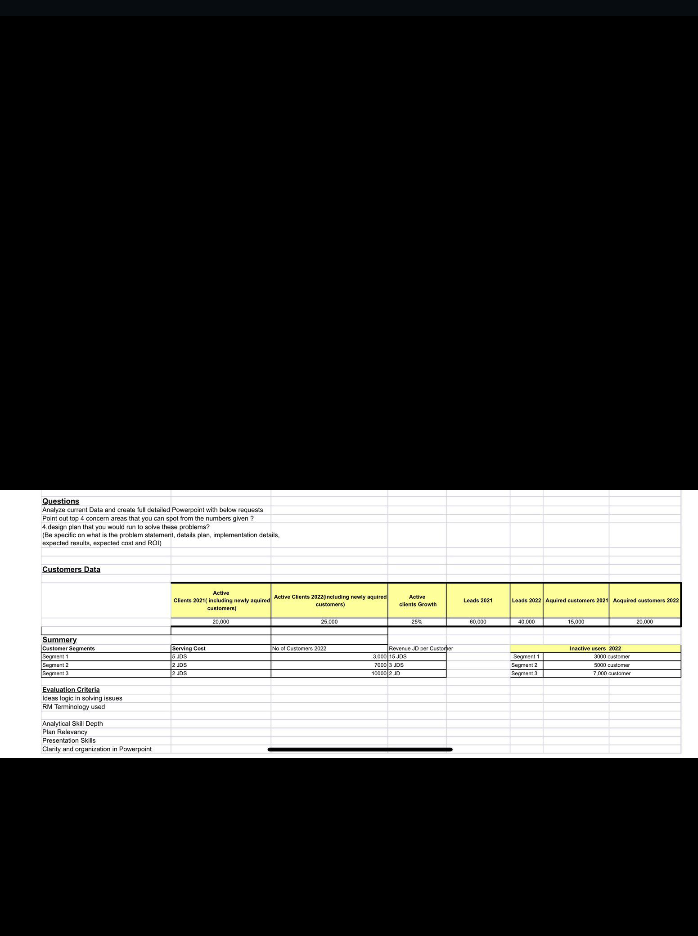
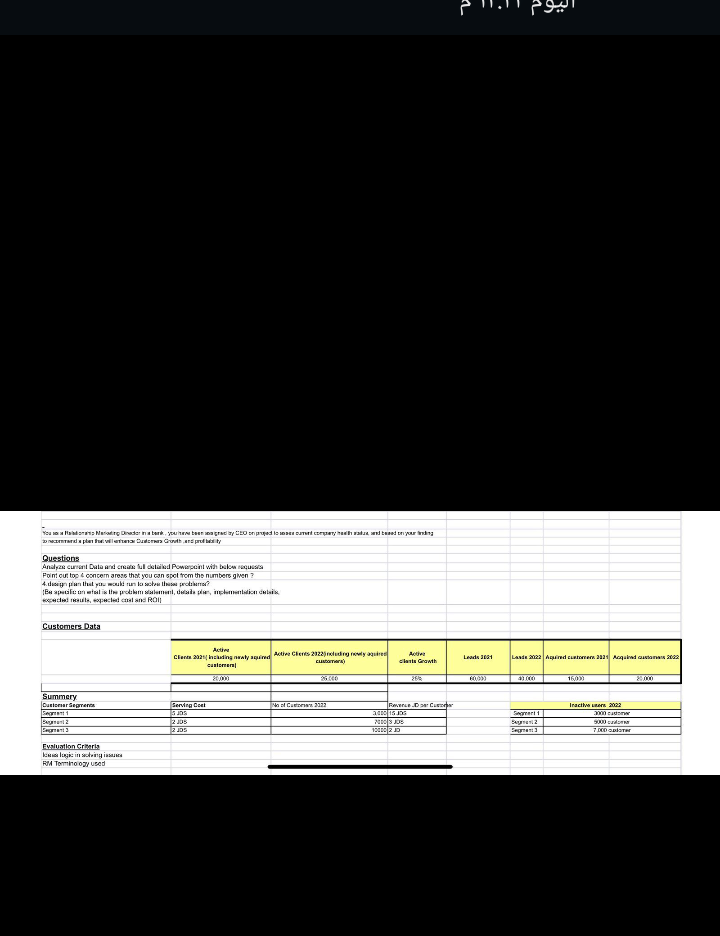
Questions Analyze current Data and create full detailed Powerpoint with below requesta Point out top 4 concern areas that you can spot from the numbers given? 4. design plan that you would run to solve the problems? Be specific on what is the problem statement, datada plan, implementation details. expected results, expected cat and ROI Customers Data Summery Customer Segments Beg1 Sant2 Sega3 Evaluation Criteria Icess logic in solving issues RM Terminology used Analytical Depth Plan Presentation Skills Clarity and organization in Powerpoint Leads 2022 Aquired customers 2321 Acquired customs 2002 Active Clients 2021 including newly aquired Active Clients 2822)luding newly qu Active Leads 5051 customers) cts Growth 20,000 25.000 250 60,093 43.000 Serving Coet 2 JDS D No of Customers 2322 Revenue De Customer 2016J06 2003 J 10000 20 15,000 Iractive users 2022 Segment 1 S2 3000 customer 5000 S3 7,000 20.000
Step by Step Solution
There are 3 Steps involved in it

Get step-by-step solutions from verified subject matter experts