

Question: Questions Graph Use the graph below when prompted to show the effects of supply and demand shocks on the market for rental cars during 2020-2021

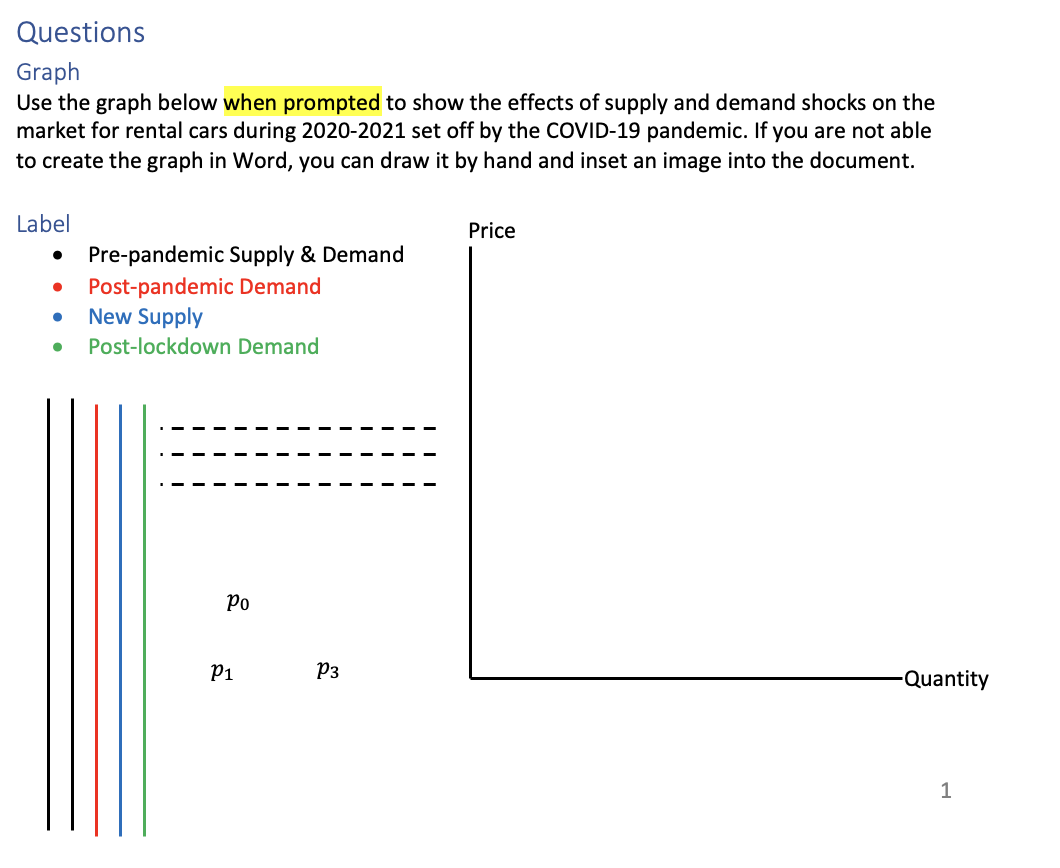
Questions Graph Use the graph below when prompted to show the effects of supply and demand shocks on the market for rental cars during 2020-2021 set off by the COVID-19 pandemic. If you are not able to create the graph in Word, you can draw it by hand and inset an image into the document. Label Price Pre-pandemic Supply & Demand Post-pandemic Demand New Supply Post-lockdown Demand Po p1 p3 Quantity
Step by Step Solution
There are 3 Steps involved in it
1 Expert Approved Answer
Step: 1 Unlock

Question Has Been Solved by an Expert!
Get step-by-step solutions from verified subject matter experts
Step: 2 Unlock
Step: 3 Unlock