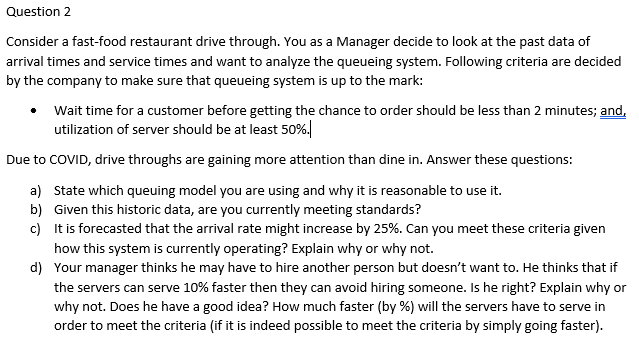
Question: Queueing Model Problem Question 2 Consider a fast-food restaurant drive through. You as a Manager decide to look at the past data of arrival times

Queueing Model Problem

Queueing Model Problem Question 2 Consider a

Queueing Model Problem Question 2 Consider a

Question 2 Consider a fast-food restaurant drive through. You as a Manager decide to look at the past data of arrival times and service times and want to analyze the queueing system. Following criteria are decided by the company to make sure that queueing system is up to the mark: Wait time for a customer before getting the chance to order should be less than 2 minutes; and, utilization of server should be at least 50%. Due to COVID, drive throughs are gaining more attention than dine in. Answer these questions: a) State which queuing model you are using and why it is reasonable to use it. b) Given this historic data, are you currently meeting standards? c) It is forecasted that the arrival rate might increase by 25%. Can you meet these criteria given how this system is currently operating? Explain why or why not. d) Your manager thinks he may have to hire another person but doesn't want to. He thinks that if the servers can serve 10% faster then they can avoid hiring someone. Is he right? Explain why or why not. Does he have a good idea? How much faster (by %) will the servers have to serve in order to meet the criteria (if it is indeed possible to meet the criteria by simply going faster). Customer number Arrival time (Minute 0 Begin service (Minute Completed service (Minute 0 0 0 1 21 11.76652658 4.932734639 14.13238239 2 3 17.70278558 2 11.76652658 14.13238239 17.70278558 21.22308451 23.53327796 12.54382848 13.2904368 14.57583855 23.53327796 4 5 6 7 8 24.07295861 26.92506118 30.58847541 28.21978553 30.36140677 30.58847541 9 10 43.41733505 11 12 43.41733505 50.87470177 60.47066237 76.4914268 81.32910494 85.46308742 50.87470177 60.47066237 76.4914268 77.28117555 83.19267451 91.2201327 93.14992153 105.5755136 21.22308451 22.91513859 28.21978553 30.36140677 30.39164264 33.37388234 46.43964766 54.8284597 64.07116807 81.32910494 85.46308742 87.93329519 96.02398922 98.79774229 108.1406038 110.5406084 114.9346756 13 14 15 16 17 18 91.2201327 96.02398922 105.5755136 108.4920204 110.5406084 19 108.4920204 20 109.2900061 Question 2 Consider a fast-food restaurant drive through. You as a Manager decide to look at the past data of arrival times and service times and want to analyze the queueing system. Following criteria are decided by the company to make sure that queueing system is up to the mark: Wait time for a customer before getting the chance to order should be less than 2 minutes; and, utilization of server should be at least 50%. Due to COVID, drive throughs are gaining more attention than dine in. Answer these questions: a) State which queuing model you are using and why it is reasonable to use it. b) Given this historic data, are you currently meeting standards? c) It is forecasted that the arrival rate might increase by 25%. Can you meet these criteria given how this system is currently operating? Explain why or why not. d) Your manager thinks he may have to hire another person but doesn't want to. He thinks that if the servers can serve 10% faster then they can avoid hiring someone. Is he right? Explain why or why not. Does he have a good idea? How much faster (by %) will the servers have to serve in order to meet the criteria (if it is indeed possible to meet the criteria by simply going faster). Customer number Arrival time (Minute 0 Begin service (Minute Completed service (Minute 0 0 0 1 21 11.76652658 4.932734639 14.13238239 2 3 17.70278558 2 11.76652658 14.13238239 17.70278558 21.22308451 23.53327796 12.54382848 13.2904368 14.57583855 23.53327796 4 5 6 7 8 24.07295861 26.92506118 30.58847541 28.21978553 30.36140677 30.58847541 9 10 43.41733505 11 12 43.41733505 50.87470177 60.47066237 76.4914268 81.32910494 85.46308742 50.87470177 60.47066237 76.4914268 77.28117555 83.19267451 91.2201327 93.14992153 105.5755136 21.22308451 22.91513859 28.21978553 30.36140677 30.39164264 33.37388234 46.43964766 54.8284597 64.07116807 81.32910494 85.46308742 87.93329519 96.02398922 98.79774229 108.1406038 110.5406084 114.9346756 13 14 15 16 17 18 91.2201327 96.02398922 105.5755136 108.4920204 110.5406084 19 108.4920204 20 109.2900061

Step by Step Solution

There are 3 Steps involved in it

1 Expert Approved Answer
Step: 1 Unlock blur-text-image
Question Has Been Solved by an Expert!

Get step-by-step solutions from verified subject matter experts

Step: 2 Unlock
Step: 3 Unlock

Students Have Also Explored These Related General Management Questions!