

Question: Quick Change Shoppe-TQMTools at Work Quick Change Shoppe is a regional chain of oil change service centers located in the tri-state area. Ken Miller is
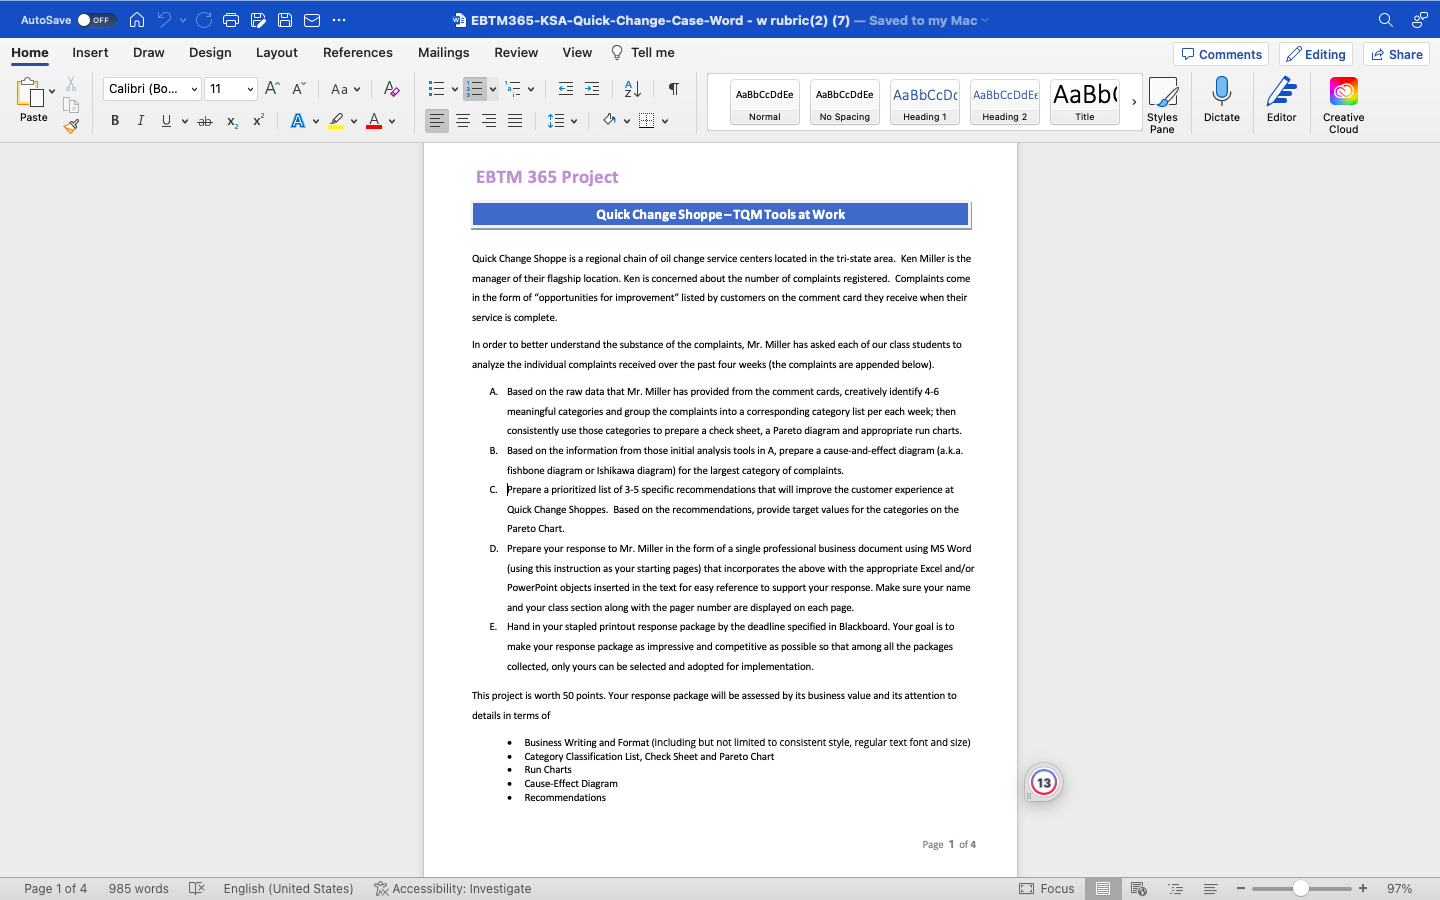
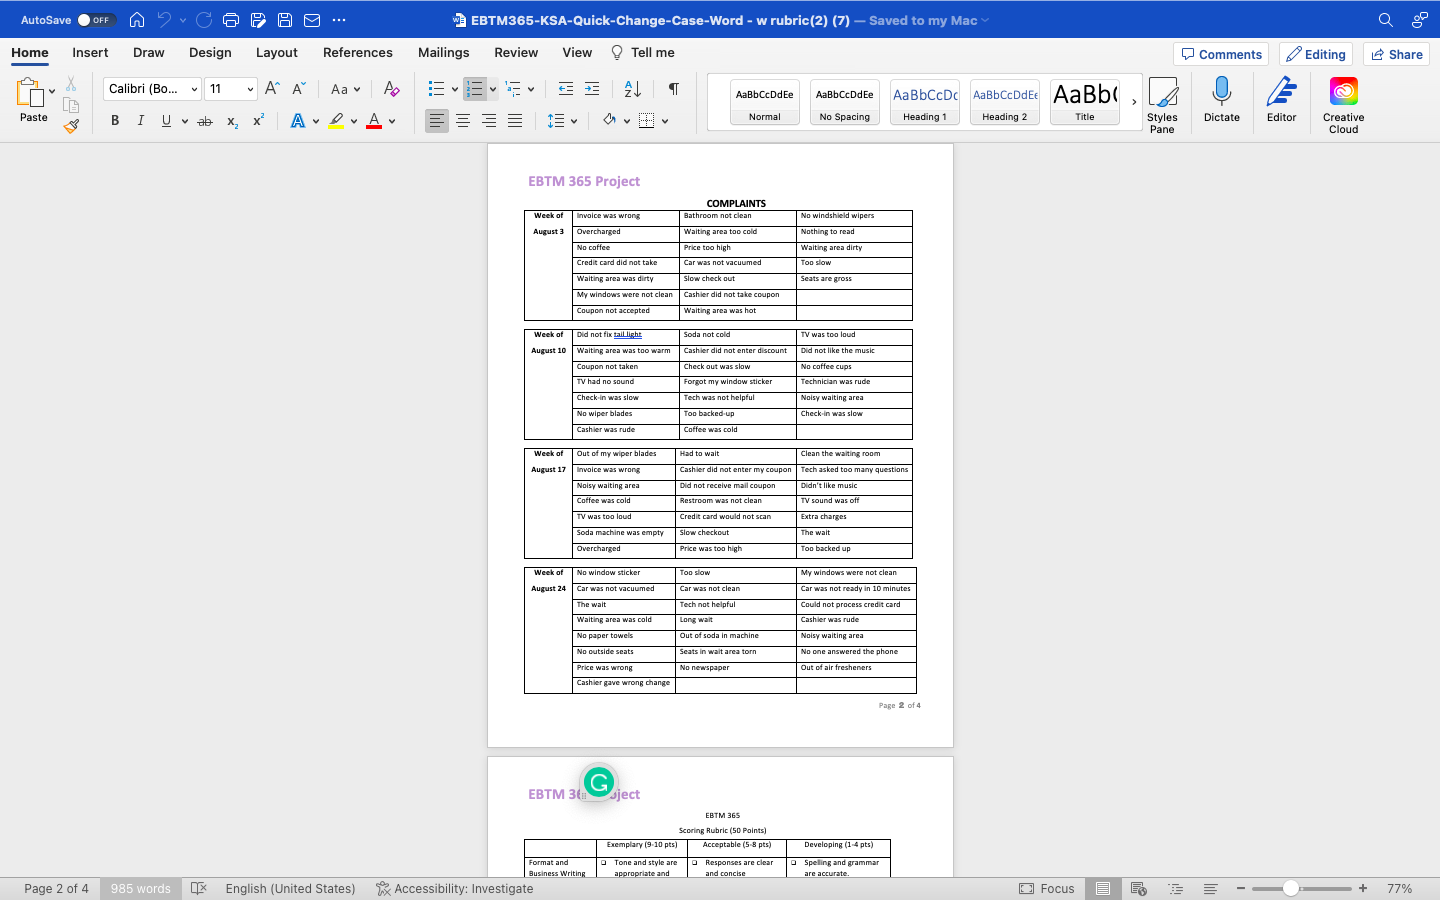
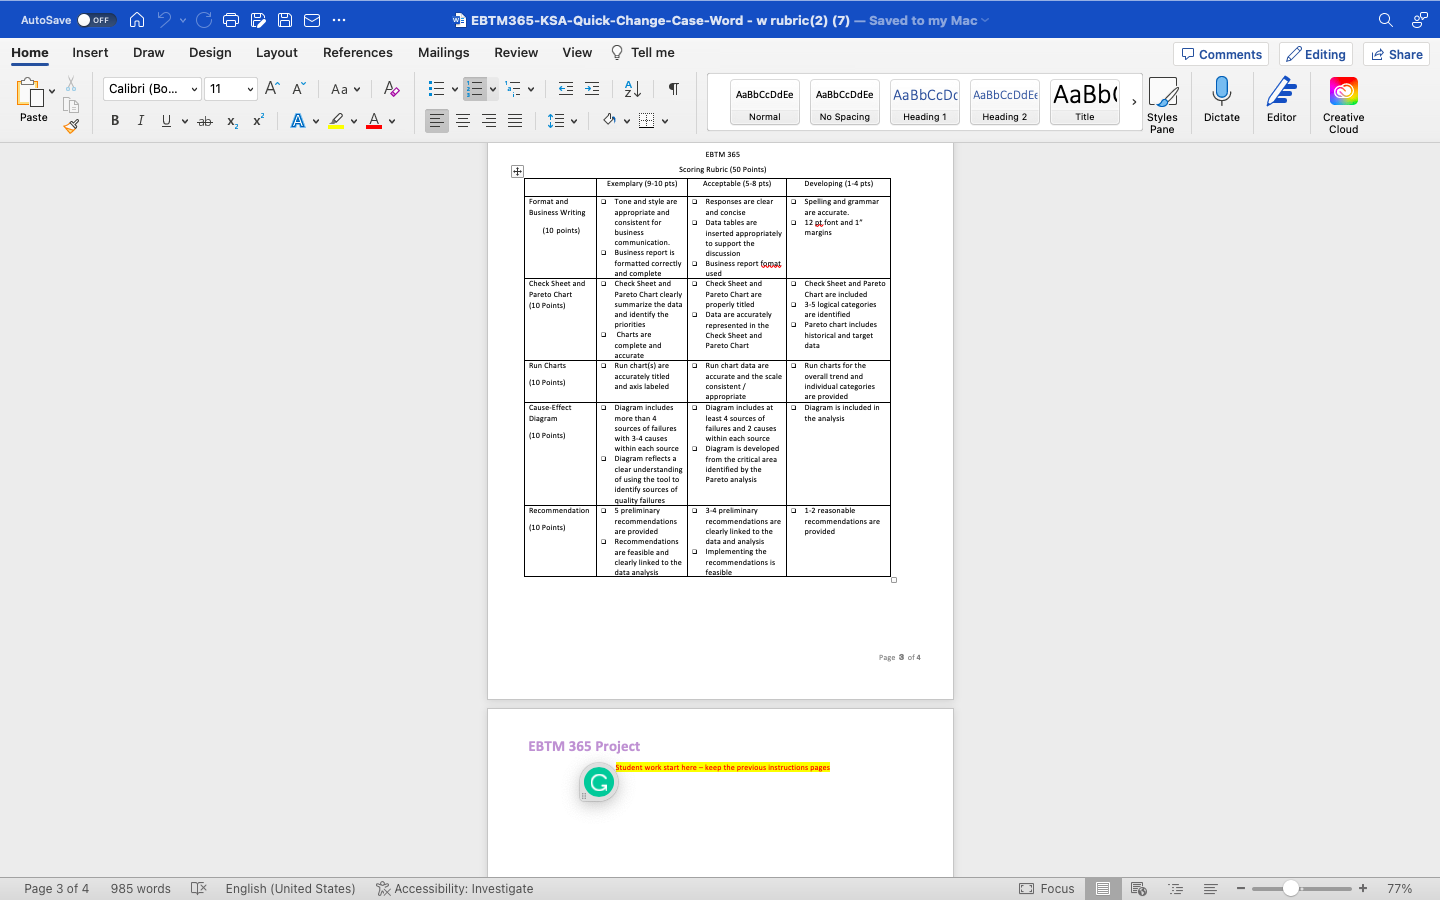
Quick Change Shoppe-TQMTools at Work Quick Change Shoppe is a regional chain of oil change service centers located in the tri-state area. Ken Miller is the manager of their flagship location. Ken is concerned about the number of complaints registered. Complaints come in the form of "opportunities for improvement" listed by customers on the comment card they receive when their service is complete. In order to better understand the substance of the complaints, Mr. Miller has asked each of our class students to analyze the individual complaints received over the past four weeks (the complaints are appended below). A. Based on the raw data that Mr. Miller has provided from the comment cards, creatively identify 4-6 meaningful categories and group the complaints into a corresponding category list per each week; then consistently use those categories to prepare a check sheet, a Pareto diagram and appropriate run charts. B. Based on the information from those initial analysis tools in A, prepare a cause-and-effect diagram (a.k.a. fishbone diagram or lshikawa diagram) for the largest category of complaints. C. Prepare a prioritized list of 3-5 specific recommendations that will improve the customer experience at Quick Change Shoppes. Based on the recommendations, provide target values for the categories on the Pareto Chart. D. Prepare your response to Mr. Miller in the form of a single professional business document using MS Word (using this instruction as your starting pages) that incorporates the above with the appropriate Excel and/or PowerPoint objects inserted in the text for easy reference to support your response. Make sure your name and your class section along with the pager number are displayed on each page. E. Hand in your stapled printout response package by the deadline specified in Blackboard. Your goal is to make your response package as impressive and competitive as possible so that among all the packages collected, only yours can be selected and adopted for implementation. This project is worth 50 points. Your response package will be assessed by its business value and its attention to details in terms of - Business Writing and Format (including but not limited to consistent style, regular text font and size) - Category Classification List, Check Sheet and Pareto Chart - Run Charts - Cause-Effect Diagram - Recommendations EBTM 365 Project
Step by Step Solution
There are 3 Steps involved in it

Get step-by-step solutions from verified subject matter experts