

Question: R RGui (64-bit) File Edit View Misc Packages Windows Help R R Console Sample . Number 01 02 03 04 05 06 07 CA WN
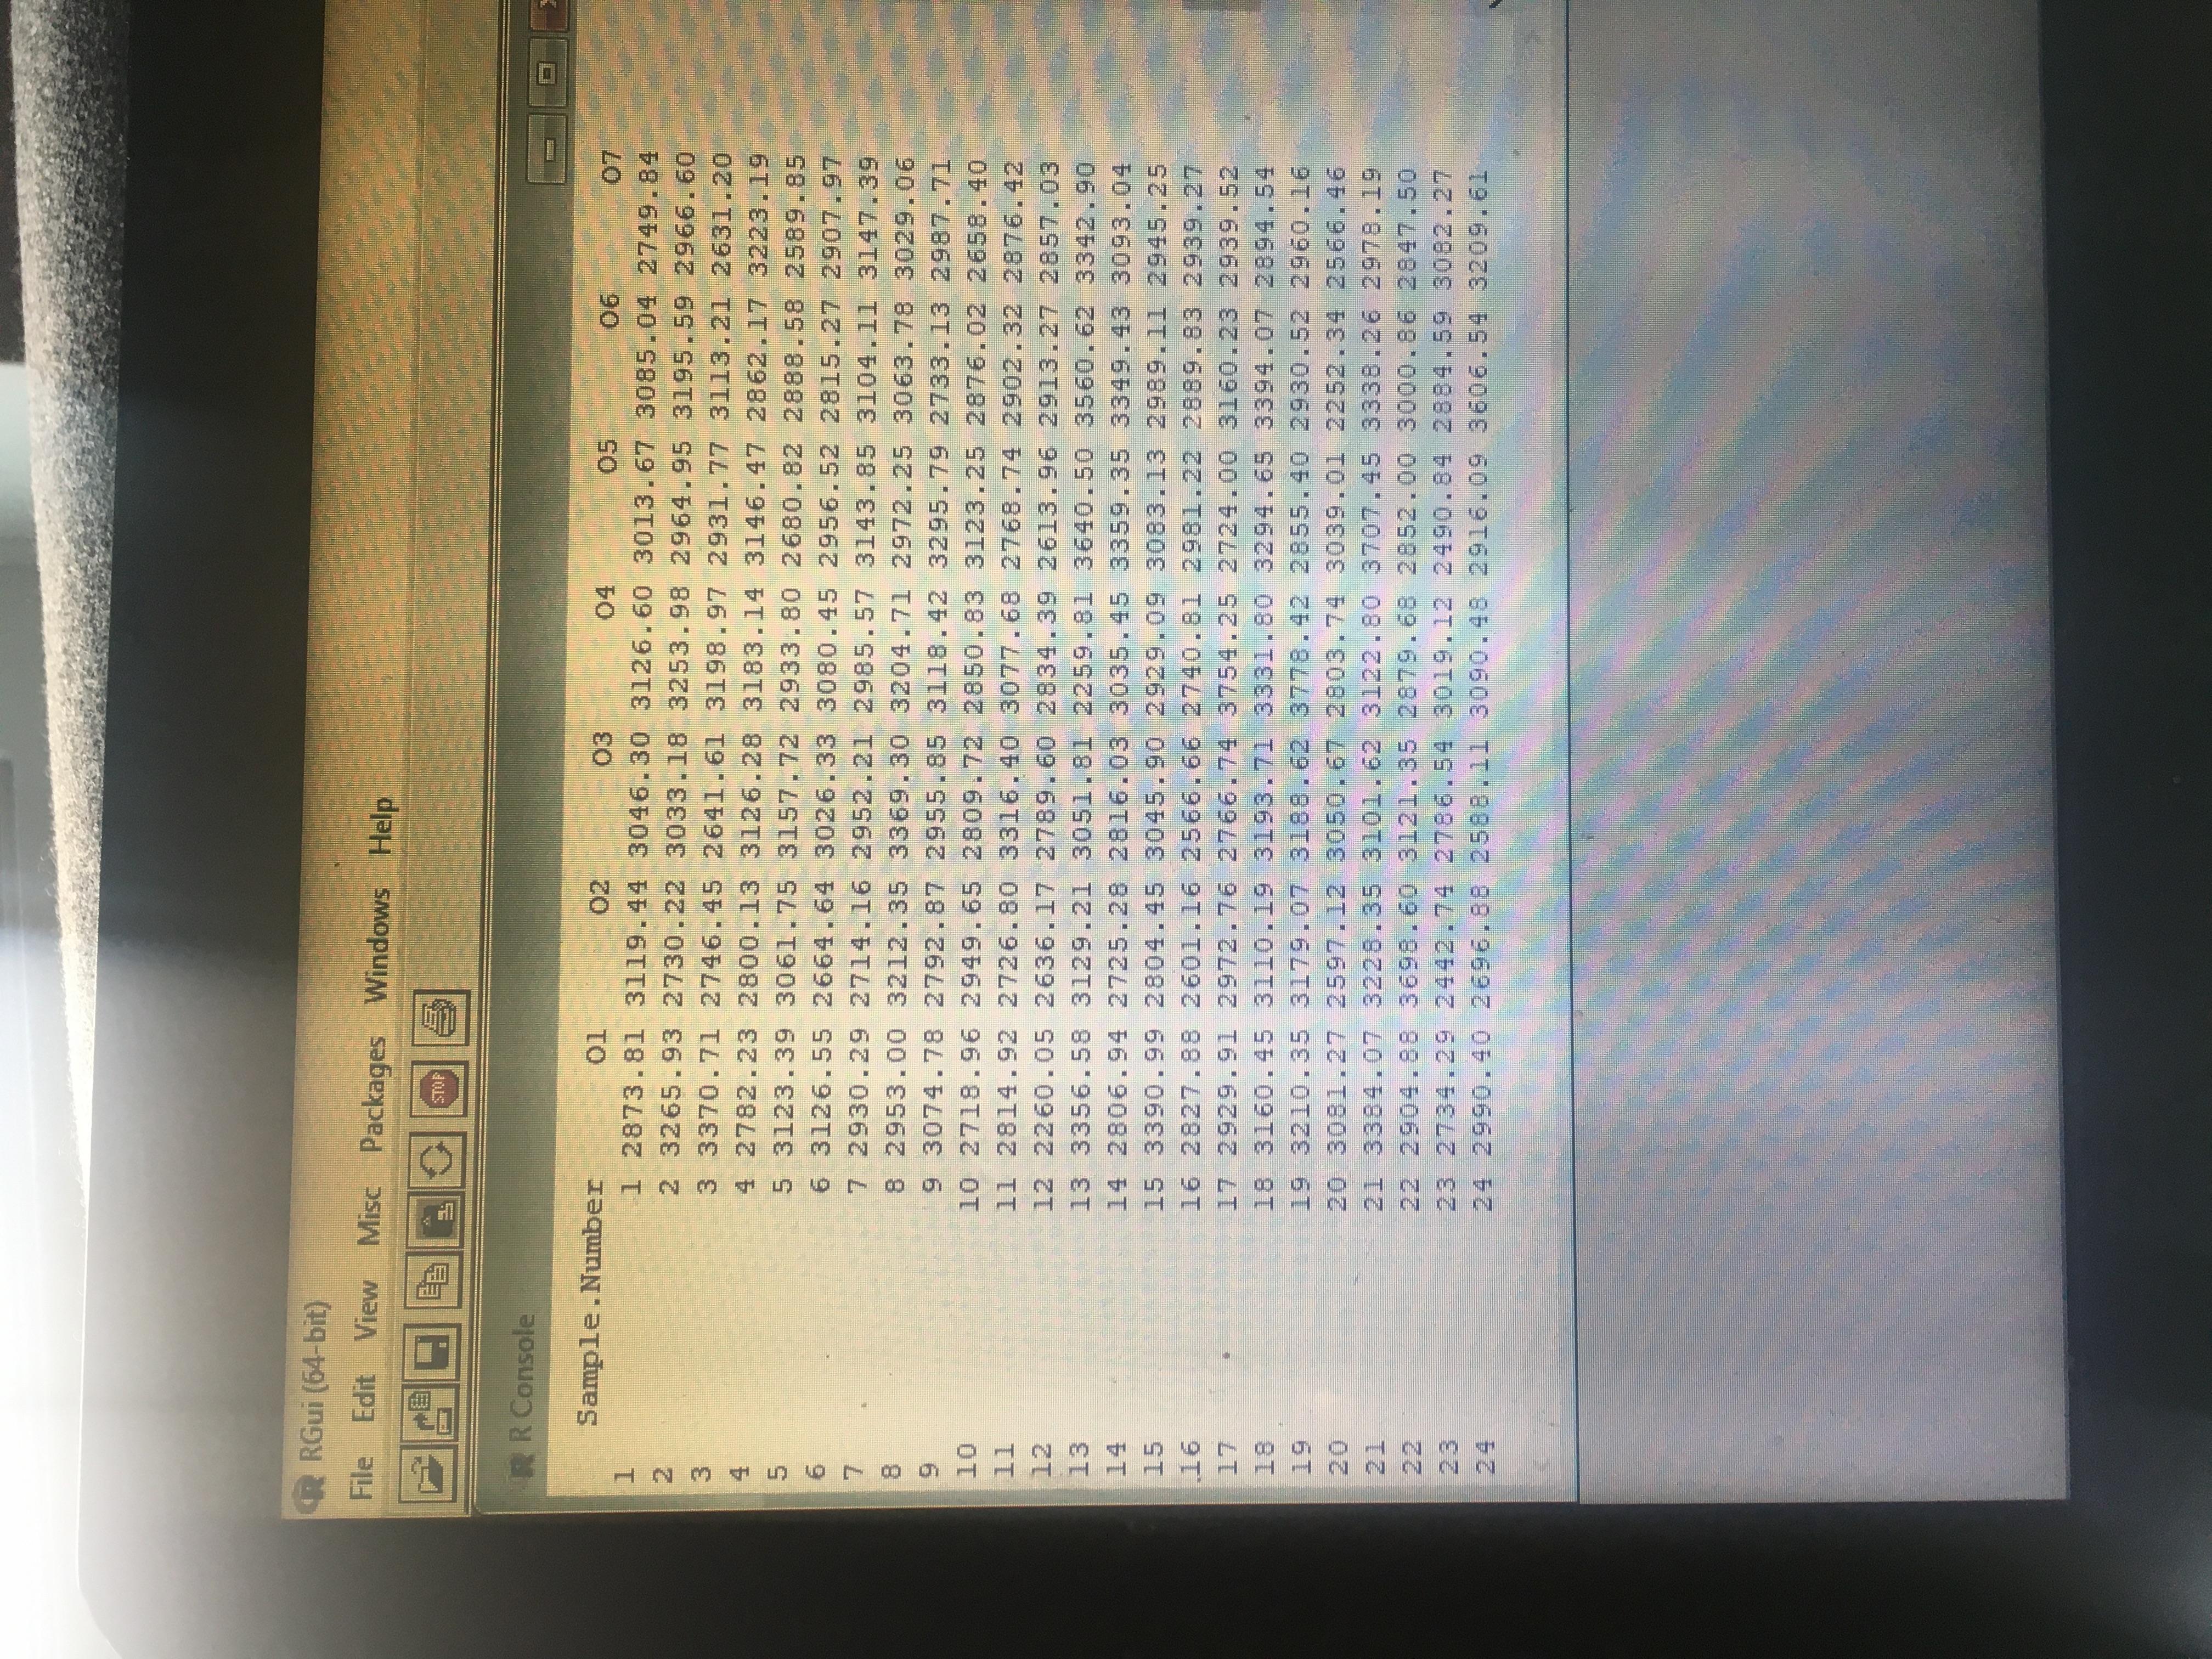
R RGui (64-bit) File Edit View Misc Packages Windows Help R R Console Sample . Number 01 02 03 04 05 06 07 CA WN 1 2873. 81 3119. 44 3046. 30 3126. 60 3013. 67 3085.04 2749.84 2 3265. 93 2730. 22 3033.18 3253. 98 2964. 95 3195.59 2966.60 3370. 71 2746. 45 2641. 61 3198. 97 2931. 77 3113.21 2631.20 4 2782 . 23 2800.13 3126. 28 3183. 14 3146. 47 2862.17 3223.19 5 3123. 39 3061.75 3157. 72 2933. 80 2680. 82 2888. 58 2589.85 6 3126. 55 2664. 64 3026. 33 3080. 45 2956. 52 2815.27 2907.97 7 2930. 29 2714. 16 2952.21 2985. 57 3143. 85 3104.11 3147.39 8 2953. 00 3212. 35 3369. 30 3204. 71 2972.25 3063. 78 3029.06 9 3074. 78 2792. 87 2955. 85 3118. 42 3295.79 2733.13 2987.71 10 10 2718. 96 2949. 65 2809. 72 2850. 83 3123.25 2876. 02 2658.40 11 11 2814. 92 2726.80 3316. 40 3077. 68 2768.74 2902. 32 2876.42 12 12 2260. 05 2636.17 2789. 60 2834. 39 2613.96 2913.27 2857.03 13 13 3356. 58 3129.21 3051. 81 2259. 81 3640. 50 3560. 62 3342.90 14 14 2806. 94 2725.28 2816. 03 3035. 45 3359. 35 3349. 43 3093.04 15 15 3390. 99 2804. 45 3045. 90 2929. 09 3083. 13 2989.11 2945.25 16 16 2827. 88 2601. 16 2566. 66 2740. 81 2981.22 2889. 83 2939.27 17 17 2929. 91 2972. 76 2766. 74 3754.25 2724.00 3160.23 2939.52 18 18 3160. 45 3110.19 3193. 71 3381. 80 3294. 65 3394.07 2894.54 19 19 3210. 35 3179. 07 3188. 62 3778. 42 2855. 40 2930. 52 2960.16 20 20 3081.27 2597. 12 3050. 67 2803.74 3039.01 2252.34 2566.46 21 21 3384. 07 3228. 35 3101. 62 3122. 80 3707. 45 3338.26 2978.19 22 22 2904. 88 3698.60 3121. 35 2879. 68 2852.00 3000. 86 2847.50 23 23 2734.29 2442. 74 2786. 54 3019. 12 2490. 84 2884. 59 3082.27 24 24 2990. 40 2696.88 2588. 11 3090. 48 2916.09 3606.54 3209.617. The viscosity of a polymer is measured in samples of size 15 every 4 hours. The Viscosity - Phase I dataset on UMLearn contains 50 samples obtained when the process was in an in-control state, along with the sample means, the sample ranges, and the sample standard deviations. The Viscosity - Phase II dataset has the same structure but consists of 30 samples obtained during the on-line monitoring process. [1] (a) Choose the most appropriate control charts for monitoring the mean and variation of this process. The following questions pertain to the control chart you chose to monitor the process mean. 12 (b) Calculate the central line and control limits for this chart. [1] (c) Create a control chart for this process in R, and attach the image here. [1] (d) Using the control chart you just created, identify the presence (or lack thereof ) of a shift in the process mean. The following questions pertain to the control chart you chose to monitor the process variation. (2] (e) Calculate the central line and control limits for this chart. (f) Create a control chart for this process in R, and attach the image here. [1] (g) Using the control chart you just created, identify the presence (or lack thereof ) of a shift in the process variation
Step by Step Solution
There are 3 Steps involved in it

Get step-by-step solutions from verified subject matter experts