

Question: R RGui (64-bit) File Edit View Misc Packages Windows Help R R Console >read. csy (file . choose ( ) , header=TRUE) A B 1
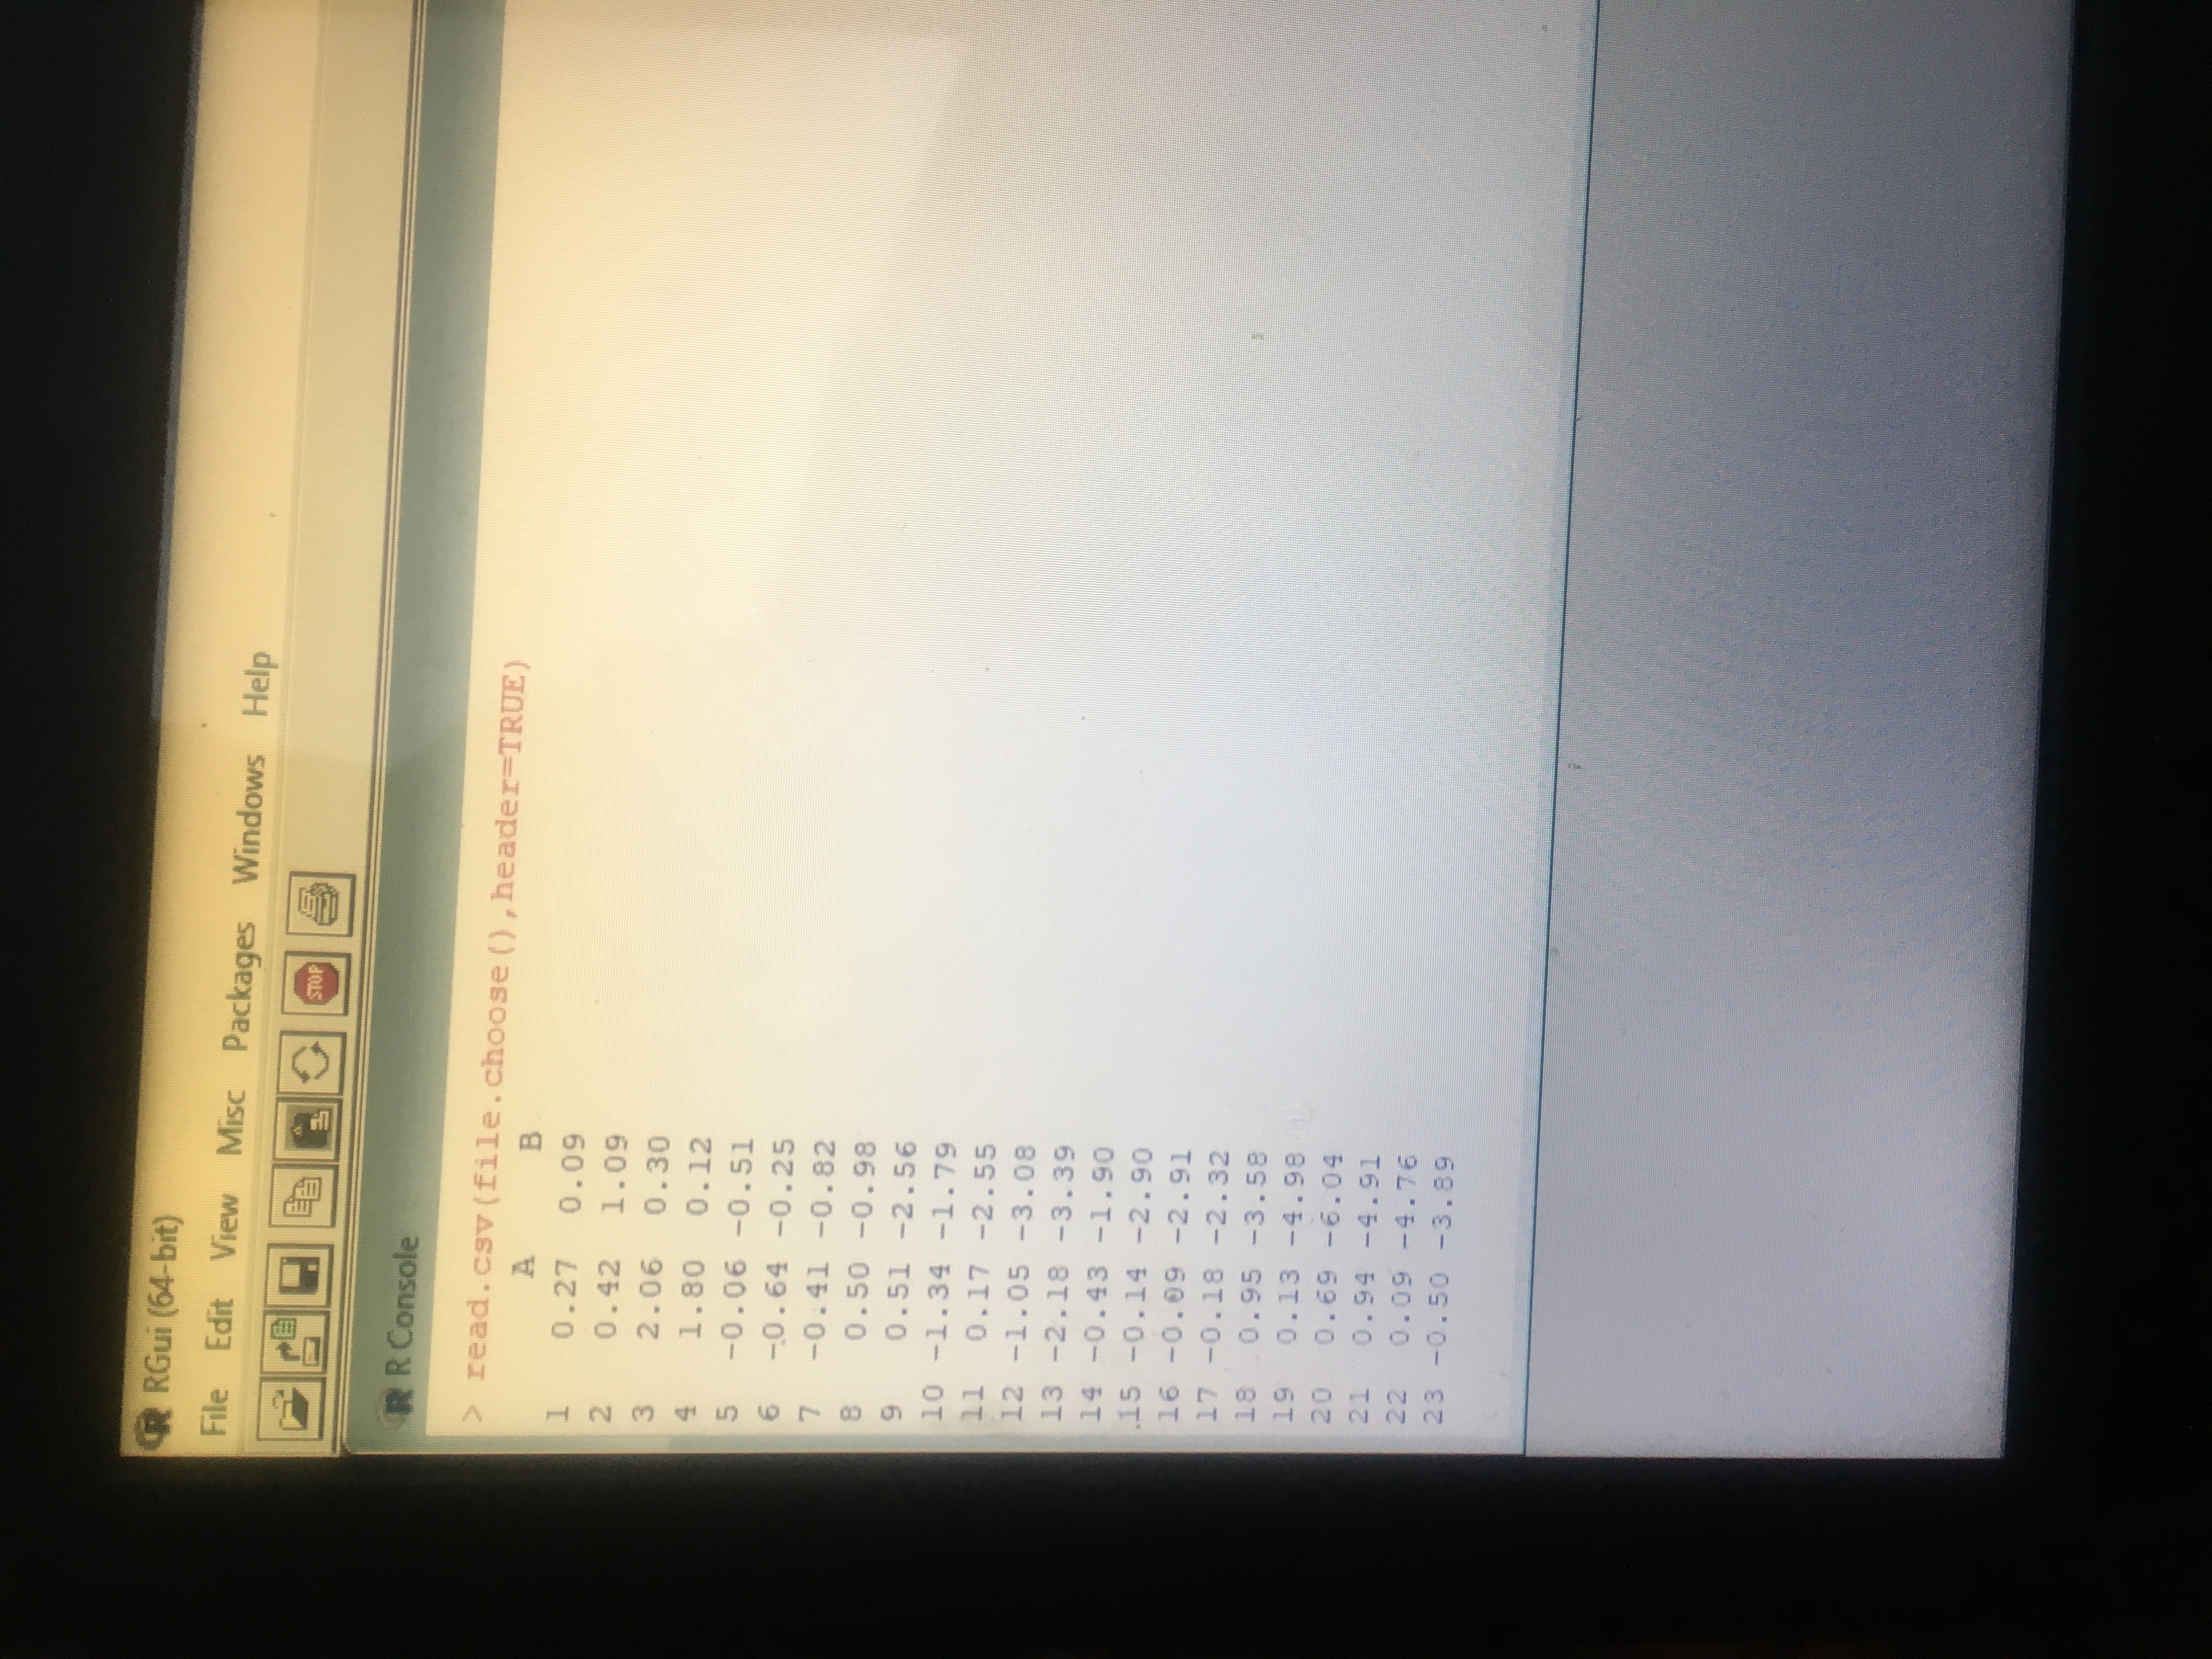
R RGui (64-bit) File Edit View Misc Packages Windows Help R R Console >read. csy (file . choose ( ) , header=TRUE) A B 1 0. 27 0.09 2 0. 42 1.09 3 2.06 0.30 4 1. 80 0. 12 -0.06 -0.51 6 -0.64 -0.25 7 -0.41 -0.82 8 0. 50 -0.98 0.51 -2.56 10 -1.34 -1.79 11 0. 17 -2.55 12 -1.05 -3.08 13 -2.18 -3.39 14 -0.43 -1.90 .15 -0.14 -2.90 16 -0.09 -2.91 7 -0.18 -2.32 18 0. 95 -3.58 19 0. 13 -4.98 20 0. 69 -6.04 21 0. 94 -4.91 22 0.09 -4.76 23 -0.50 -3.89[2] 2. Download the Phase 1 Datasets dataset on UMLearn. This dataset contains two columns of data, labelled A and B. Each column gives a sequence of 80 sample means obtained from an in-control process. Using R, create a line graph for each column. Based on these graphs, for which process will a Shewhart control chart be more applicable? Why
Step by Step Solution
There are 3 Steps involved in it

Get step-by-step solutions from verified subject matter experts