

Question: R STUDIO AND STATISITCS PLEASE PROVIDE THE CODES FOR THESE QUESTIONS (a) Display the data in a two-way table. Make a mosaic plot and comment
R STUDIO AND STATISITCS
PLEASE PROVIDE THE CODES FOR THESE QUESTIONS
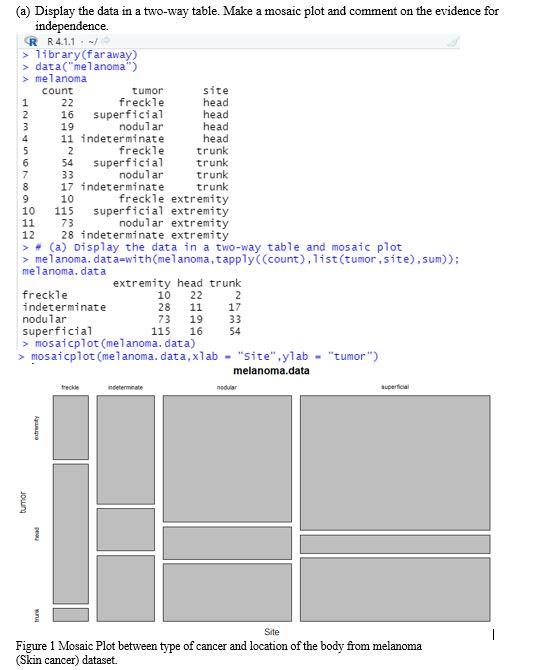
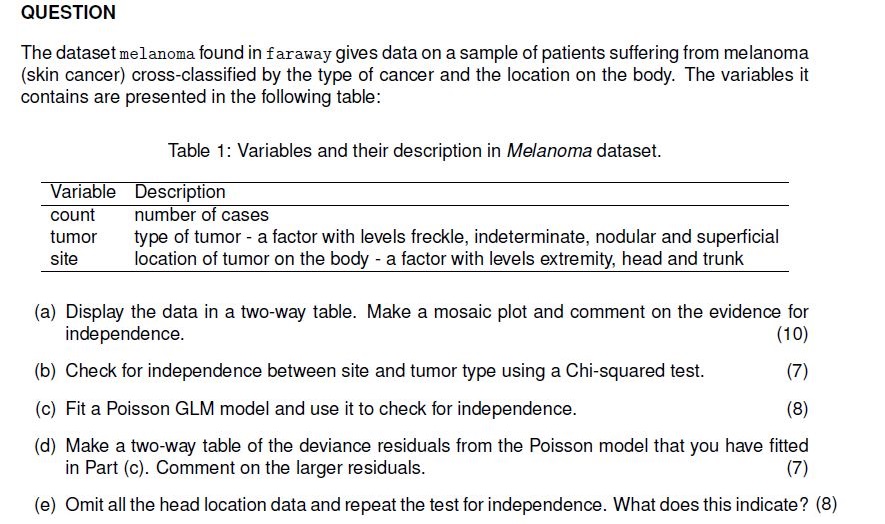
(a) Display the data in a two-way table. Make a mosaic plot and comment on the evidence for independence. R R4.1.1 . -/ > library (far away) > data ("melanoma") > melanoma count tumor site 22 freckle head 16 superficial head 19 nodular head 11 indeterminate head 5 2 freckle trunk 6 54 superficial trunk 7 33 nodular trunk 8 17 indeterminate trunk 9 10 freckle extremity 10 115 superficial extremity 11 73 nodular extremity 12 28 indeterminate extremity > # (a) Display the data in a two-way table and mosaic plot >melanoma. data-with(melanoma, tapply((count) , list (tumor , site), sum)); melanoma, data extremity head trunk freckle 10 22 2 indeterminate 28 11 17 nodular 73 19 33 superficial 115 16 54 > mosaicplot (melanoma. data) > mosaicplot (melanoma. data, xlab - "site",ylab - "tumor") melanoma.data tackle Indeterminate nodular tumor Site Figure 1 Mosaic Plot between type of cancer and location of the body from melanoma (Skin cancer) dataset.\fQUESTION The dataset melanoma found in faraway gives data on a sample of patients suffering from melanoma (skin cancer) cross-classified by the type of cancer and the location on the body. The variables it contains are presented in the tollowing table: Table 1: Variables and their description in Melanoma dataset. Variable Description count number of cases tumor type of tumor - atactor with levels freckle, indeterminate, nodular and superficial site location of tumor on the body - a factor with levels extremity, head and trunk (a) Display the data in a two-way table. Make a mosaic plot and comment on the evidence for independence. {1 D) (b) Check for independence between site and tumor type using a Chi-squared test. U) (c) Fit a Poisson GLM model and use it to check for independence. {8} (d) Make a two-way table of the deviance residuals from the Poisson model that you have titted in Part {c}. Comment on the larger residuals. {7) (e) Omit all the head location data and repeat the test tor independence. What does this indicate? {8)
Step by Step Solution
There are 3 Steps involved in it

Get step-by-step solutions from verified subject matter experts