

Question: Radioactivity and Radiation 1. Use your graph paper to plot a graph of the number of remaining dimes versus the number of throws (trial number).
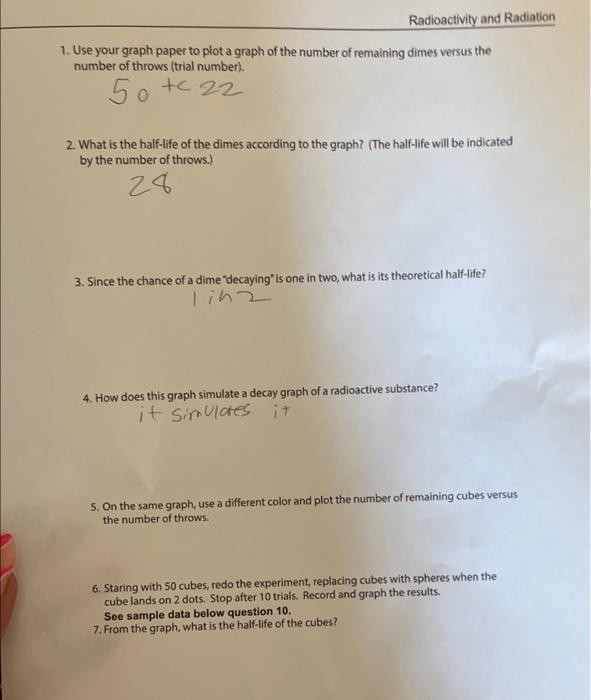
Radioactivity and Radiation 1. Use your graph paper to plot a graph of the number of remaining dimes versus the number of throws (trial number). 50tc22 2. What is the half-life of the dimes according to the graph? (The half-life will be indicated by the number of throws.) 28 3. Since the chance of a dime decaying" is one in two, what is its theoretical half-life? lin2 4. How does this graph simulate a decay graph of a radioactive substance? it simulares it 5. On the same graph, use a different color and plot the number of remaining cubes versus the number of throws 6. Staring with 50 cubes, redo the experiment, replacing cubes with spheres when the cube lands on 2 dots. Stop after 10 trials. Record and graph the results. See sample data below question 10. 7. From the graph, what is the half-life of the cubes? Radioactivity and Radiation 1. Use your graph paper to plot a graph of the number of remaining dimes versus the number of throws (trial number). 50tc22 2. What is the half-life of the dimes according to the graph? (The half-life will be indicated by the number of throws.) 28 3. Since the chance of a dime decaying" is one in two, what is its theoretical half-life? lin2 4. How does this graph simulate a decay graph of a radioactive substance? it simulares it 5. On the same graph, use a different color and plot the number of remaining cubes versus the number of throws 6. Staring with 50 cubes, redo the experiment, replacing cubes with spheres when the cube lands on 2 dots. Stop after 10 trials. Record and graph the results. See sample data below question 10. 7. From the graph, what is the half-life of the cubes
Step by Step Solution
There are 3 Steps involved in it

Get step-by-step solutions from verified subject matter experts