

Question: Rainy Day Manufacturing is analyzing data with regards to operating costs from last year: Required: a. Using Excel, prepare a scatter-graph of the data with
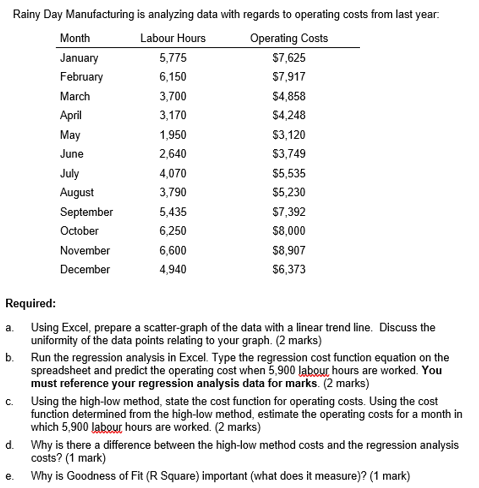
Rainy Day Manufacturing is analyzing data with regards to operating costs from last year: Required: a. Using Excel, prepare a scatter-graph of the data with a linear trend line. Discuss the uniformity of the data points relating to your graph. (2 marks) b. Run the regression analysis in Excel. Type the regression cost function equation on the spreadsheet and predict the operating cost when 5,900 labour, hours are worked. You must reference your regression analysis data for marks. (2 marks) c. Using the high-low method, state the cost function for operating costs. Using the cost function determined from the high-low method, estimate the operating costs for a month in which 5,900 labour hours are worked. (2 marks) d. Why is there a difference between the high-low method costs and the regression analysis costs? (1 mark) e. Why is Goodness of Fit (R Square) important (what does it measure)? (1 mark)
Step by Step Solution
There are 3 Steps involved in it

Get step-by-step solutions from verified subject matter experts