

Question: Random samples are drawn independently from two normally distributed populations, and the following statistics are obtained: Group 1 Group 2 n1=24 n2-21 X=262.4 X2=266.2
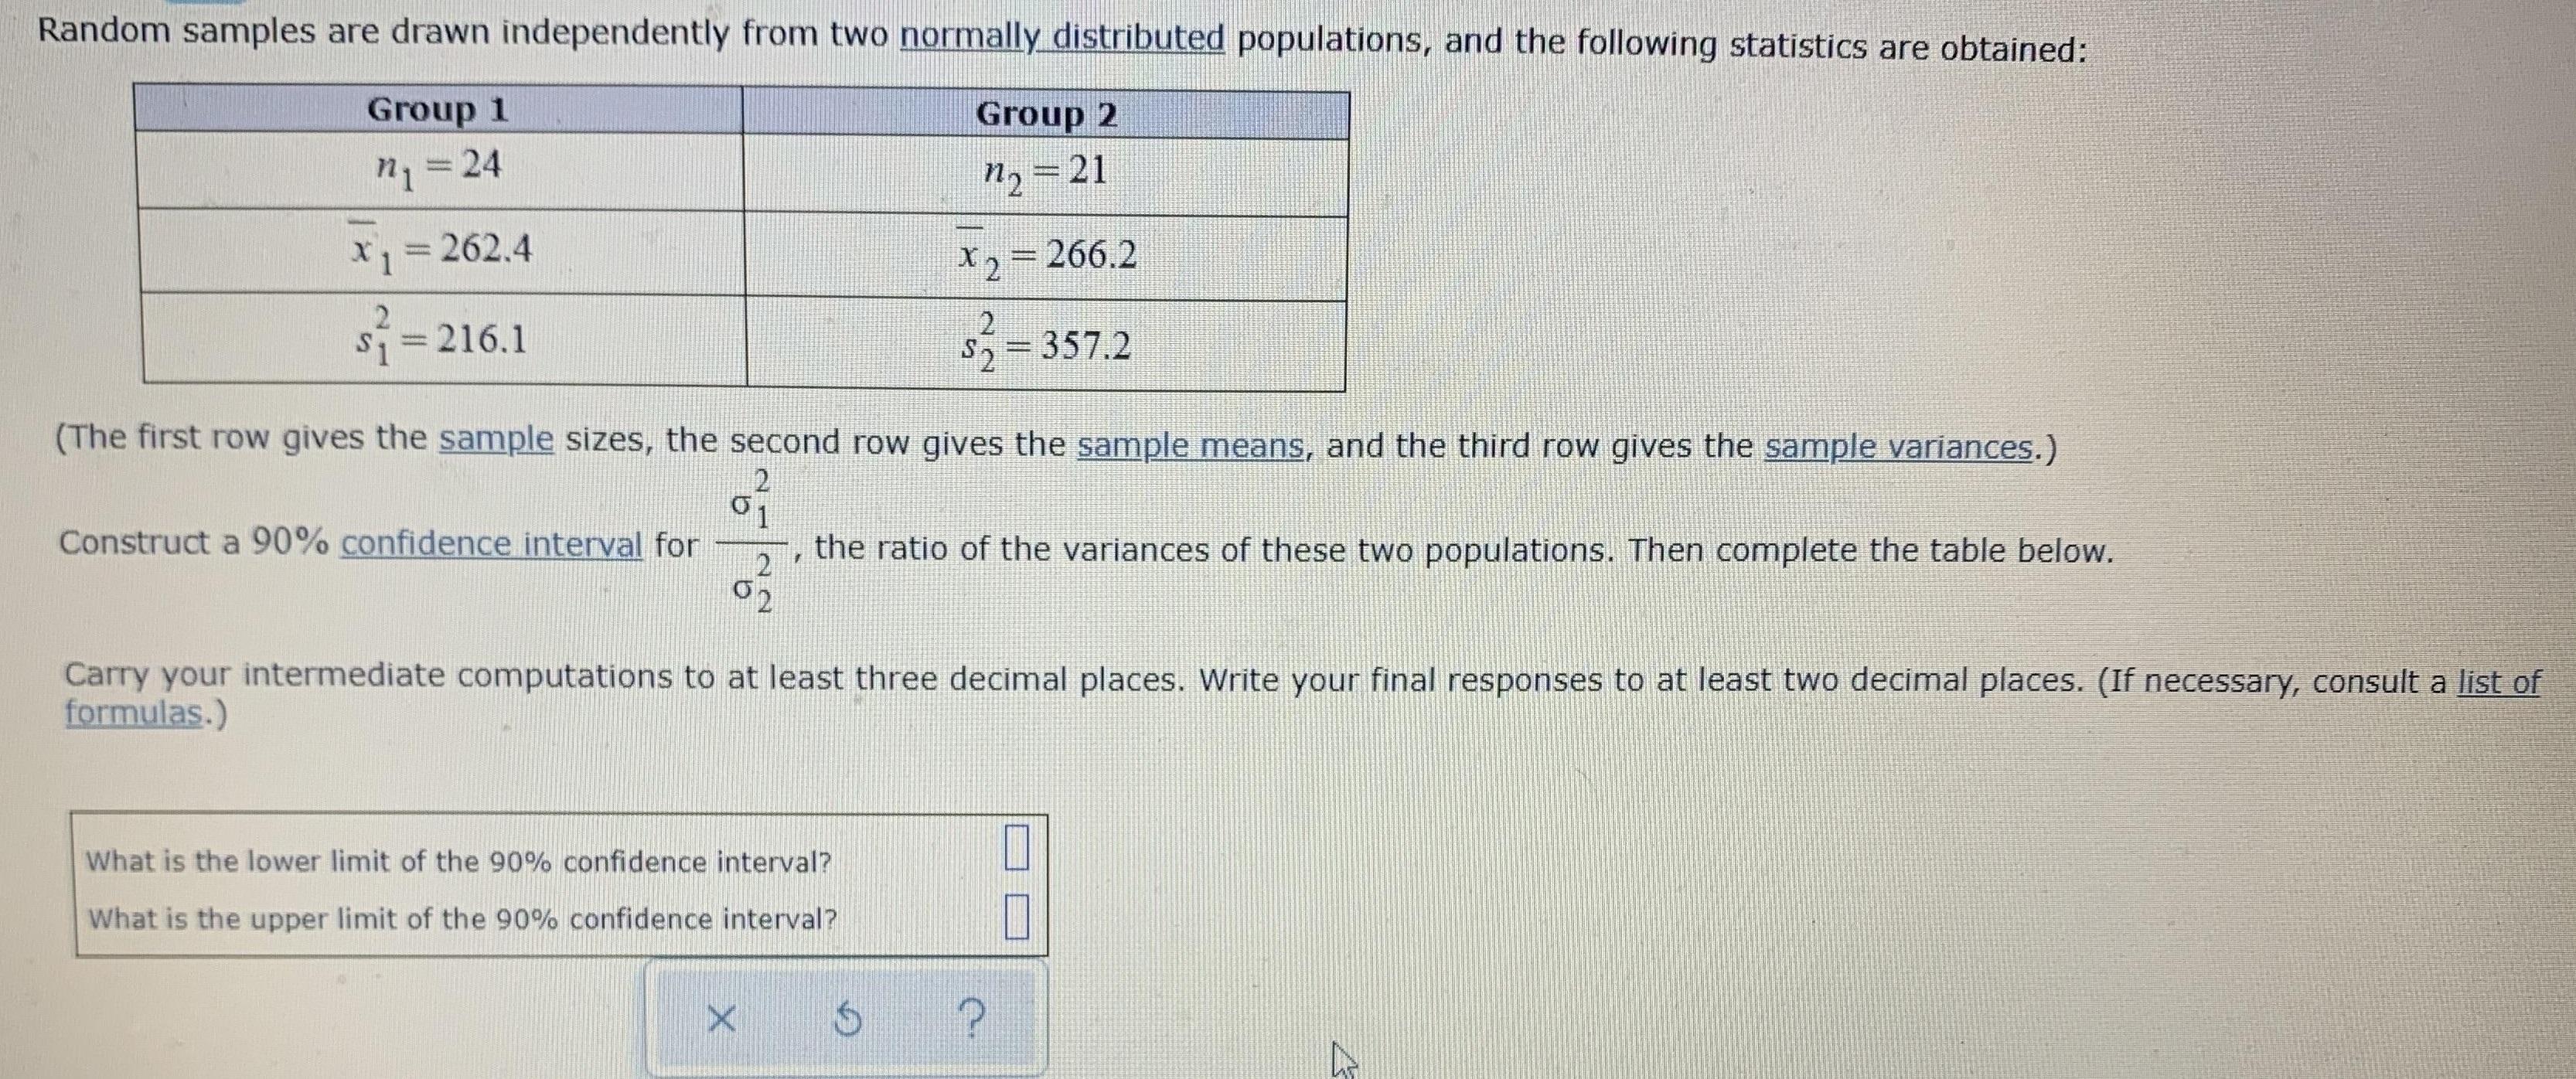
Random samples are drawn independently from two normally distributed populations, and the following statistics are obtained: Group 1 Group 2 n1=24 n2-21 X=262.4 X2=266.2 si=216.1 = 357.2 (The first row gives the sample sizes, the second row gives the sample means, and the third row gives the sample variances.) 01 the ratio of the variances of these two populations. Then complete the table below. Construct a 90% confidence interval for Carry your intermediate computations to at least three decimal places. Write your final responses to at least two decimal places. (If necessary, consult a list of formulas.) What is the lower limit of the 90% confidence interval? What is the upper limit of the 90% confidence interval?
Step by Step Solution
3.45 Rating (155 Votes )
There are 3 Steps involved in it

Get step-by-step solutions from verified subject matter experts