

Question: Random samples are drawn independently from two normally distributed populations, and the following statistics are obtained. Group 1 Group 2 n = 23 n, =
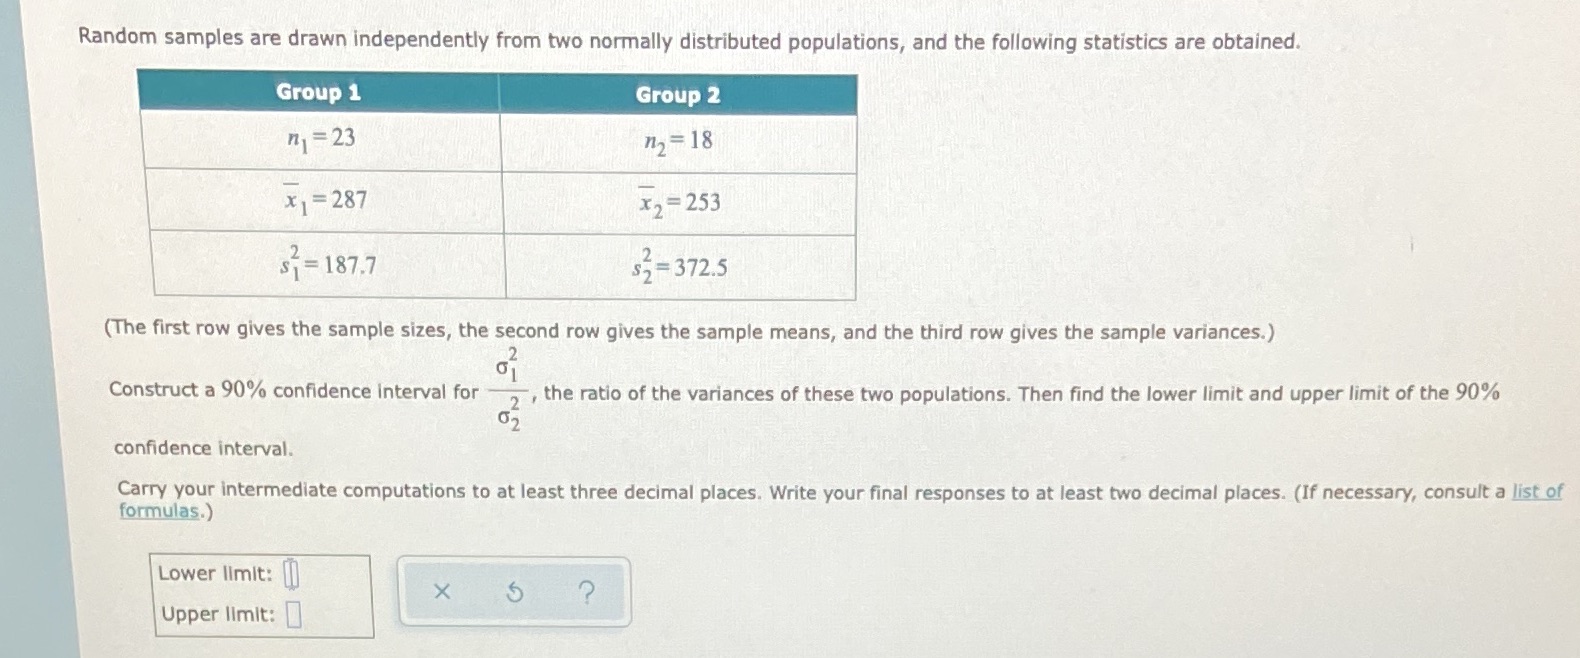
Random samples are drawn independently from two normally distributed populations, and the following statistics are obtained. Group 1 Group 2 n = 23 n, = 18 x =287 x, = 253 S = 187.7 $7 = 372.5 (The first row gives the sample sizes, the second row gives the sample means, and the third row gives the sample variances.) Construct a 90% confidence interval for , the ratio of the variances of these two populations. Then find the lower limit and upper limit of the 90% confidence interval. Carry your intermediate computations to at least three decimal places. Write your final responses to at least two decimal places. (If necessary, consult a list of formulas.) Lower limit: X ? Upper limit
Step by Step Solution
There are 3 Steps involved in it

Get step-by-step solutions from verified subject matter experts