

Question: Rating Below is an interval plot from Minitab. How would you interpret this plot? What does it tell you about the effect of age
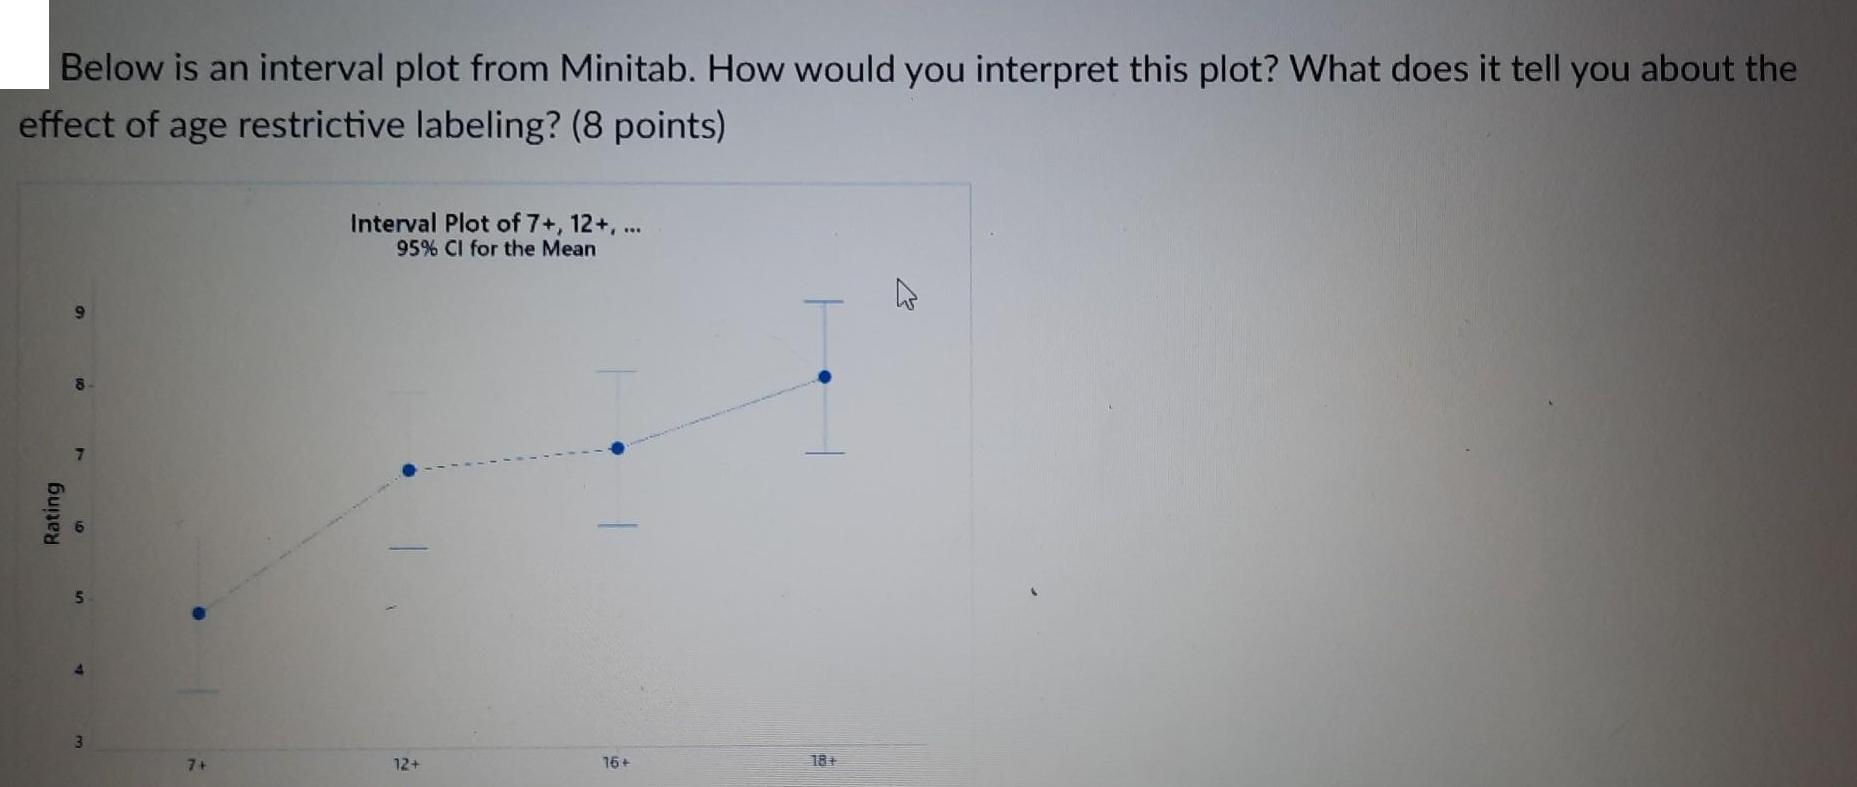
Rating Below is an interval plot from Minitab. How would you interpret this plot? What does it tell you about the effect of age restrictive labeling? (8 points) 8 Interval Plot of 7+, 12+, ... 95% CI for the Mean 3 74 12+ 76+ 18+ h 13
Step by Step Solution
There are 3 Steps involved in it
1 Expert Approved Answer
Step: 1 Unlock

The plot helps analyze the impact of age on the response variable by comparin... View full answer
Question Has Been Solved by an Expert!
Get step-by-step solutions from verified subject matter experts
Step: 2 Unlock
Step: 3 Unlock