

Question: RATIO ANALYSIS Data for Barry Computer Co. and its industry averages follow. Barry Computer Company: Balance Sheet as of December 31, 2016 (In Thousands) Cash
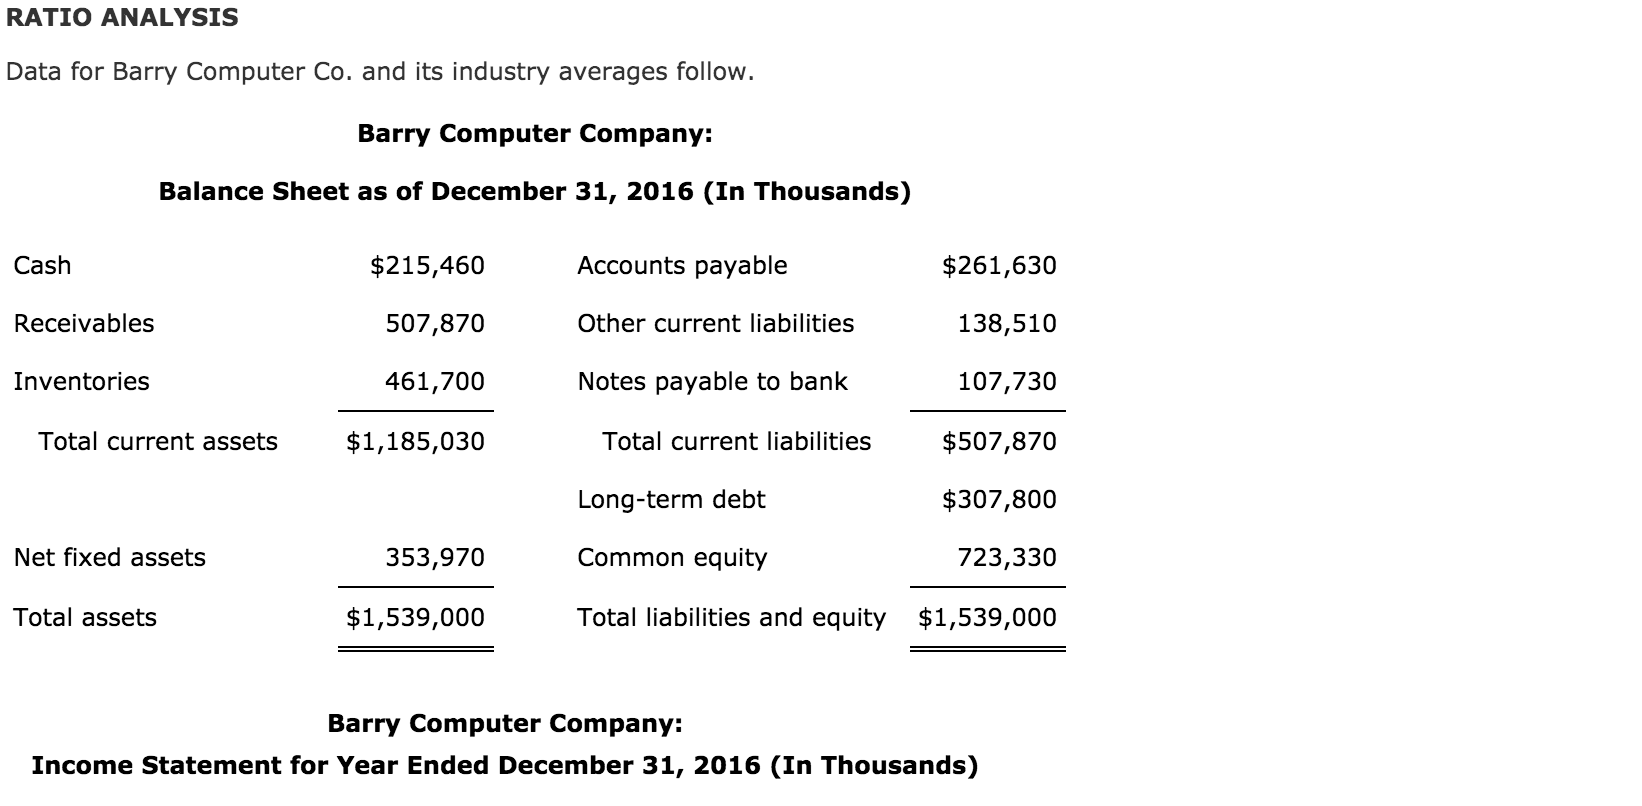
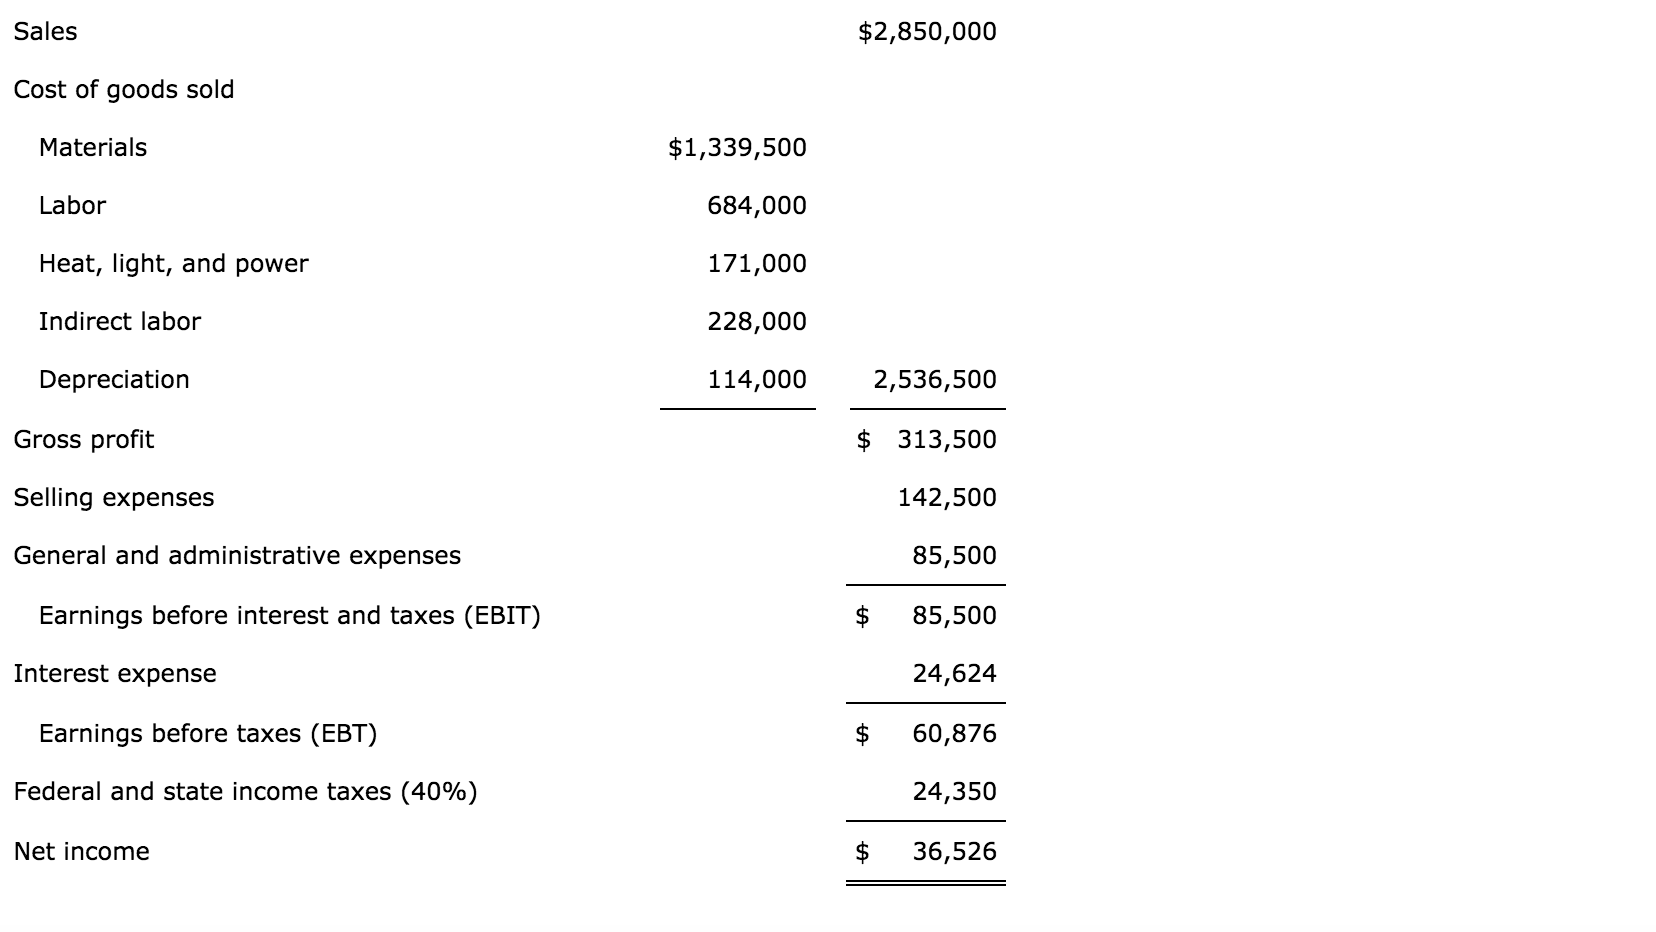
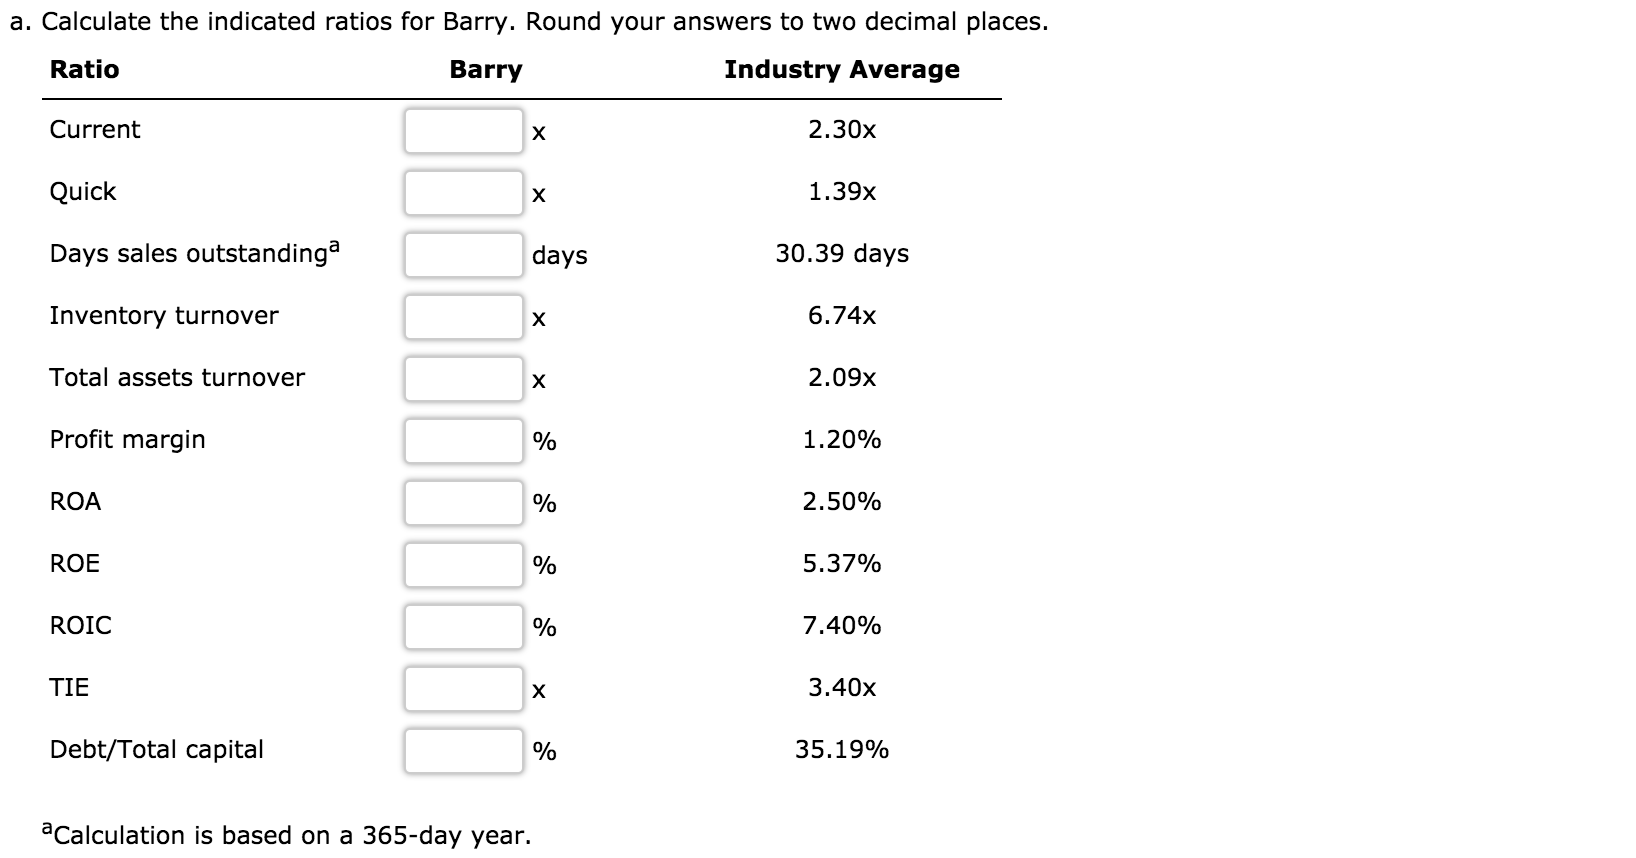
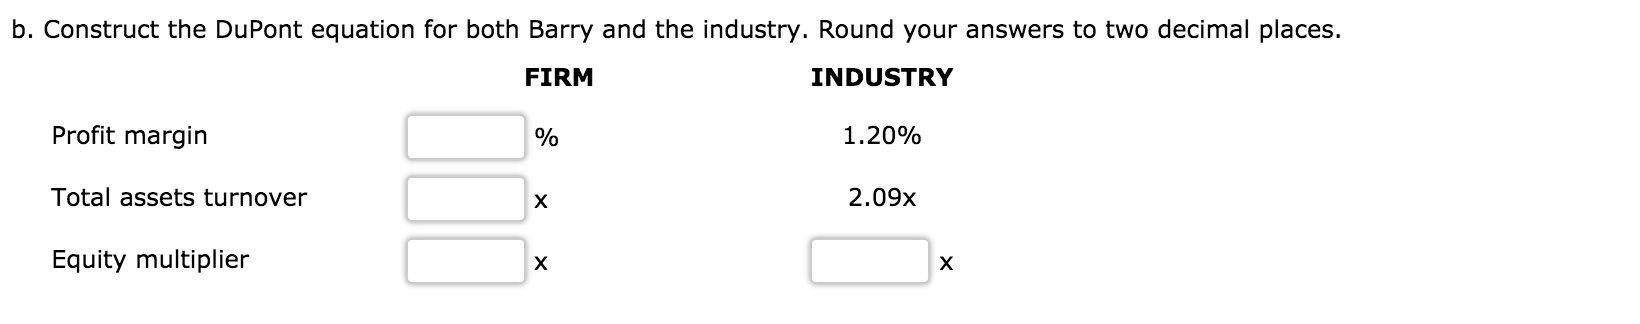
RATIO ANALYSIS Data for Barry Computer Co. and its industry averages follow. Barry Computer Company: Balance Sheet as of December 31, 2016 (In Thousands) Cash $215,460 Accounts payable $261,630 Receivables 507,870 Other current liabilities 138,510 Inventories 461,700 Notes payable to bank 107,730 Total current assets $1,185,030 Total current liabilities $507,870 Long-term debt $307,800 Net fixed assets 353,970 Common equity 723,330 Total assets $1,539,000 Total liabilities and equity $1,539,000 Barry Computer Company: Income Statement for Year Ended December 31, 2016 (In Thousands) Sales $2,850,000 Cost of goods sold Materials $1,339,500 Labor 684,000 Heat, light, and power 171,000 Indirect labor 228,000 Depreciation 114,000 2,536,500 Gross profit $ 313,500 Selling expenses 142,500 General and administrative expenses 85,500 Earnings before interest and taxes (EBIT) 85,500 Interest expense 24,624 Earnings before taxes (EBT) $ 60,876 24,350 Federal and state income taxes (40%) Net income $ 36,526 a. Calculate the indicated ratios for Barry. Round your answers to two decimal places. Ratio Barry Industry Average Current 2.30x Quick 1.39x Days sales outstandinga days 30.39 days Inventory turnover 6.74x Total assets turnover 2.09x Profit margin 1.20% ROA 2.50% ROE 5.37% ROIC 7.40% TIE 3.40x Debt/Total capital 35.19% a Calculation is based on a 365-day year. b. Construct the DuPont equation for both Barry and the industry. Round your answers to two decimal places. FIRM INDUSTRY Profit margin 1.20% Total assets turnover 2.09x Equity multiplier
Step by Step Solution
There are 3 Steps involved in it

Get step-by-step solutions from verified subject matter experts