

Question: Ratio analysis for the ratios shown on Table 1 in the Guide to Case Analysis (CA) of the textbook: Profitability ratios Liquidity ratios Leverage ratios
- Ratio analysis for the ratios shown on Table 1 in the Guide to Case Analysis (CA) of the textbook:
- Profitability ratios
- Liquidity ratios
- Leverage ratios
- Activity ratios
- Price-to-earnings ratio
- The changes between years are included in the calculations
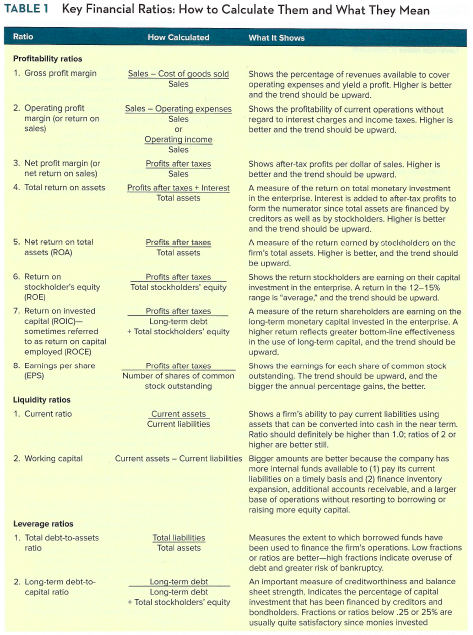
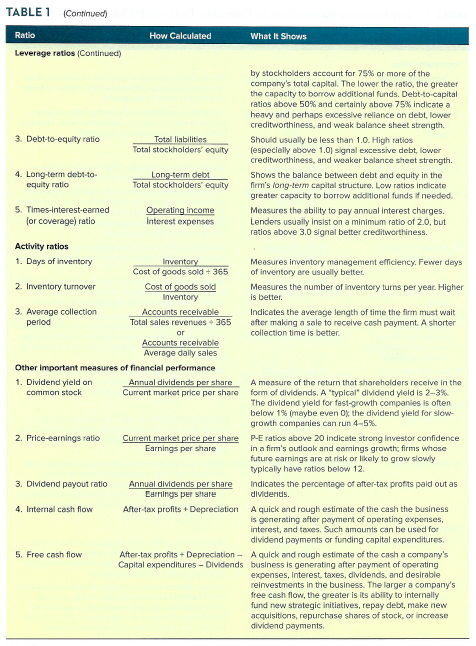
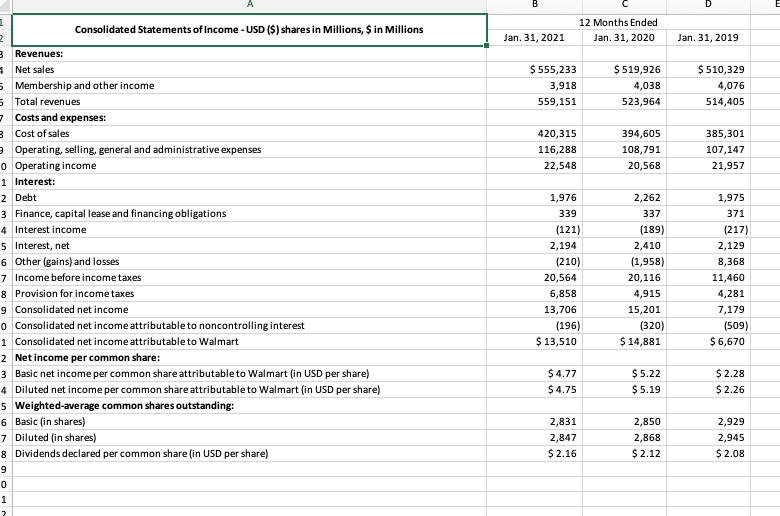
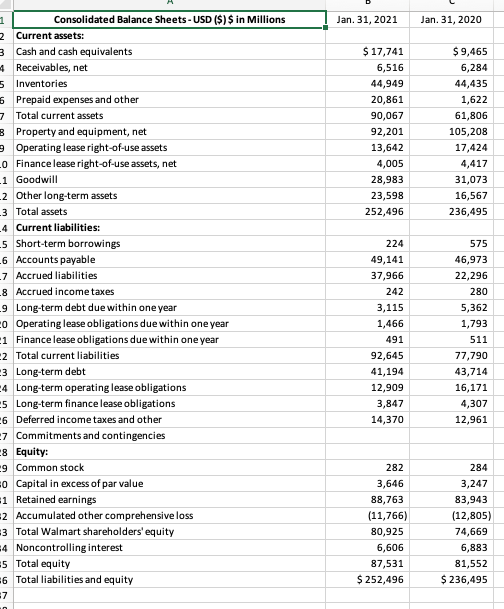
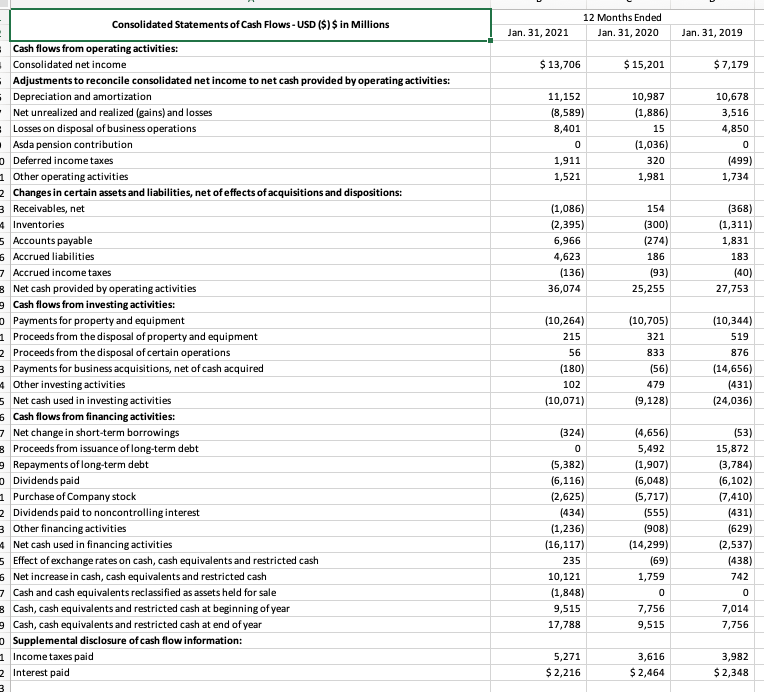
TABLE 1 Key Financial Ratios: How to Calculate Them and What They Mean Ratio How Calculated What It Shows Profitability ratios 1. Gross profit margin Sales-Cost of goods sold Sales Shows the percentage of revenues available to cover operating expenses and yield a profit. Higher is better and the trend should be upward. Shows the profitability of current operations without regard to interest charges and income taxes. Higher is better and the trend should be upward. 2. Operating profit margin for return on sales) Sales - Operating expenses Sales or Operating income Sales Profits after taxes Sales Profits after taxes + Interest Total assets 3. Net profit margin for net return on sales) 4. Total return on assets 5. Net return on total assets (ROA) Profits after taxes Total assets Profits after taxes Total stockholders' equity 6. Return on stockholder's equity IROEI 7. Return on invested capital (ROICH- Sometimes referred to as return on capital employed ROCE) 8. Earnings per share (EPS) Shows after-tax profits per dollar of sales. Higher is better and the trend should be upward. A measure of the return on total monetary investment in the enterprise. Interest is added to after-tax profits to form the numerator since total assets are financed by creditors as well as by stockholders. Higher is better and the trend should be upward. A measure of the return comed by stocleholders on the firm's total assets. Higher is better, and the trend should be upward. Shows the return stockholders are earning on their capital investment in the enterprise. A return in the 12-15% range is "average, and the trend should be upward. A measure of the return shareholders are earning on the long-term monetary capital invested in the enterprise. A higher retum reflects greater bottom-line effectiveness in the use of long-term capital, and the trend should be upward. Shows the earnings for each share of common stock outstanding. The trend should be upward, and the bigger the annual percentage gains, the better. Profits after taxes Long-term debt + Total stockholders' equity Profits after taxes Number of shares of common stock outstanding Liquidity ratios 1. Current ratio 2. Working capital Current assets Shows a firm's ability to pay current liabilities using Current liabilities assets that can be corrverted into cash in the near term. Ratio should definitely be higher than 1.0, ratios of 2 or higher are better stil Current assets - Current liabilities Bigger amounts are better because the company has more internal funds available to (1) pay its current liabilities on a timely basis and (2) finance inventory expansion, additional accounts receivable, and a larger base of operations without resorting to borrowing or raising more equity capital Leverage ratios 1. Total debt-to-assets ratio Total llabilities Total assets 2. Long-term debt-to- capital ratio Long-term debt Long-term debt Total stockholders' equity Measures the extent to which borrowed funds have been used to finance the firm's operations. Low fractions or ratios are better-high fractions indicate overuse of debt and greater risk of bankruptcy. An important measure of creditworthiness and balance sheet strength. Indicates the percentage of capital investment that has been financed by creditors and bondholders. Fractions or ratios below.25 or 25% are usually quite satisfactory since monies invested TABLE 1 (Continued Ratio How Calculated What It Shows Leverage ratios (Continued) by stockholders account for 75% or more of the company's total capital. The lower the ratio, the greater the capacity to borrow additional funds. Debt-to-capital ratios above 50% and certainly above 75% indicate a heavy and perhaps excessive reliance on debt, lower creditworthiness, and weak balance sheet strength. 3. Debt-to-equity ratio Total liabilities Should usually be less than 1.0. High ratios Total stockholders' equity (especially above 1.0) Signal excessive debt, lower creditworthiness, and weaker balance sheet strength. 4. Long-term debito Long-term debt Shows the balance between debt and equity in the equity ratio Total stockholders' equity firm's long-term capital structure. Low ratios indicate greater capacity to borrow additional funds if needed. 5. Times-interest-eamed Operating Income Measures the ability to pay annual interest charges. for coverage) ratio Interest expenses Lenders usually insist on a minimum ratio of 2.0, but ratios above 3.0 signal better creditworthiness. Activity ratios 1. Days of inventory Inventory Measures inventory management efficiency. Fewer days Cost of goods sold + 365 of inventory are usually better 2. Inventory turnover Cost of goods sold Measures the number of inventory turns per year. Higher Inventory is better. 3. Average collection Accounts receivable Indicates the average length of time the firm must wait period Total sales revenues 365 after making a sale to receive cash payment. A shorter or collection time is better Accounts receivable Average daily sales Other important measures of financial performance 1. Dividend yield on Annual dividends per share A measure of the return that shareholders receive in the common stock Current market price per share form of dividends. A typical' dividend yield is 2-3% The dividend yield for fast-growth companies is often below 1% (maybe even the dividend yield for slow- growth companies can run 4-5% 2. Price-earnings ratio Current market price per shere P-E ratios above 20 indicete strong investor confidence Earnings per share in a firm's outlook and earnings growth, firms whose future earnings are at risk or likely to grow slowly typically have ratios below 12. 3. Dividend payout ratio Annual dividends per share Indicates the percentage of after-tax profits paid out as Earrings per share dividends. 4. Internal cash flow After-tax profits + Depreciation A quick and rough estimate of the cash the business is generating after payment of operating expenses, interest, and taxes. Such amounts can be used for dividend payments or funding capital expenditures. 5. Free cash flow After-tax profits + Depreciation - A quick and rough estimate of the cash a company's Capital expenditures - Dividends business is generating after payment of operating expenses, Interest, taxes, dividends, and desirable reinvestments in the business. The larger a company's free cash flow, the greater is its ability to internally fund new strategic initiatives, repay debt, make new acquisitions, repurchase shares of stock, or increase dividend payments B D 12 Months Ended Jan. 31, 2020 Jan. 31, 2021 Jan. 31, 2019 $ 555,233 3,918 559,151 $ 519,926 4,038 523,964 $ 510,329 4,076 514,405 420,315 116,288 22,548 394,605 108,791 20,568 385,301 107,147 21,957 1,975 371 1 Consolidated Statements of Income - USD ($) shares in Millions, $ in Millions 2 3 Revenues: Net sales 5 Membership and other income 5 Total revenues - Costs and expenses: 3 Cost of sales Operating, selling, general and administrative expenses o Operating income 1 Interest: 2 Debt 3 Finance, capital lease and financing obligations 4 Interest income 5 Interest, net 6 Other (gains) and losses 7 Income before income taxes 8 Provision for income taxes 9 Consolidated net income o Consolidated net income attributable to noncontrolling interest 1 Consolidated net income attributable to Walmart 2 Net income per common share: 3 Basic net income per common share attributable to Walmart (in USD per share) 4 Diluted net income per common share attributable to Walmart (in USD per share) 5 Weighted average common shares outstanding: 6 Basic (in shares) 7 Dil (in shares) 8 Dividends declared per common share in USD per share) 9 0 1 1,976 339 (121) 2,194 (210) 20,564 6,858 13,706 (196) $ 13,510 2,262 337 (189) 2,410 (1,958) 20,116 4,915 15,201 (320) $ 14,881 (217) 2,129 8,368 11,460 4,281 7,179 (509) $6,670 $ 4.77 $ 4.75 $5.22 $5.19 $2.28 $ 2.26 2,831 2,847 $ 2.16 2,850 2,868 $ 2.12 2,929 2,945 $ 2.08 7 Jan. 31, 2021 Jan. 31, 2020 $ 17,741 6,516 44,949 20,861 90,067 92,201 13,642 4,005 28,983 23,598 252,496 $ 9,465 6,284 44,435 1,622 61,806 105,208 17,424 4,417 31,073 16,567 236,495 224 1 Consolidated Balance Sheets - USD ($) $ in Millions 2 Current assets: 3 Cash and cash equivalents 4 Receivables, net 5 Inventories Prepaid expenses and other 7 Total current assets 8 Property and equipment, net Operating lease right-of-use assets o Finance lease right-of-use assets, net -1 Goodwill 2 Other long-term assets 3 Total assets -4 Current liabilities: 5 Short-term borrowings 6 Accounts payable -7 Accrued liabilities 8 Accrued income taxes 9 Long-term debt due within one year o Operating lease obligations due within one year 1 Finance lease obligations due within one year 2 Total current liabilities 3 Long-term debt 4 Long-term operating lease obligations 5 Long-term finance lease obligations 6 Deferred income taxes and other 7 Commitments and contingencies 8 Equity: -9 Common stock o Capital in excess of par value 1 Retained earnings 2 Accumulated other comprehensive loss 3 Total Walmart shareholders' equity 4 Noncontrolling interest 5 Total equity 6 Total liabilities and equity 7 49,141 37,966 242 3,115 1,466 491 92,645 41,194 12,909 3,847 14,370 575 46,973 22,296 280 5,362 1,793 511 77,790 43,714 16,171 4,307 12,961 282 3,646 88,763 (11,766) 80,925 6,606 87,531 $ 252,496 284 3,247 83,943 (12,805) 74,669 6,883 81,552 $ 236,495 12 Months Ended Jan. 31, 2020 Jan. 31, 2021 Jan. 31, 2019 $ 13,706 $ 15,201 $ 7,179 11,152 (8,589) 8,401 0 1,911 1,521 10,987 (1,886) 15 (1,036) 320 1,981 10,678 3,516 4,850 0 (499) 1,734 (1,086) (2,395) 6,966 4,623 (136) 36,074 154 (300) (274) 186 (93) 25,255 (368) (1,311) 1,831 183 (40) 27,753 (10,264) 215 Consolidated Statements of Cash Flows - USD ($) $ in Millions - Cash flows from operating activities: Consolidated net income Adjustments to reconcile consolidated net income to net cash provided by operating activities: Depreciation and amortization Net unrealized and realized (gains) and losses Losses on disposal of business operations Asda pension contribution Deferred income taxes Other operating activities Changes in certain assets and liabilities, net of effects of acquisitions and dispositions: 3 Receivables, net 4 Inventories 5 Accounts payable 6 Accrued liabilities 7 Accrued income taxes 8 Net cash provided by operating activities Cash flows from investing activities: Payments for property and equipment 1 Proceeds from the disposal of property and equipment 2 Proceeds from the disposal of certain operations 3 Payments for business acquisitions, net of cash acquired 4 Other investing activities 5 Net cash used in investing activities 6 Cash flows from financing activities: 7 Net change in short-term borrowings 8 Proceeds from issuance of long-term debt Repayments of long-term debt Dividends paid 1 Purchase of Company stock 2 Dividends paid to noncontrolling interest 3 Other financing activities 4 Net cash used in financing activities 5 Effect of exchange rates on cash, cash equivalents and restricted cash 6 Net increase in cash, cash equivalents and restricted cash 7 Cash and cash equivalents reclassified as assets held for sale 3 Cash, cash equivalents and restricted cash at beginning of year Cash, cash equivalents and restricted cash at end of year Supplemental disclosure of cash flow information: 1 Income taxes paid 2 Interest paid 56 (10,705) 321 833 (56) 479 (9,128) (10,344) 519 876 (14,656) (431) (24,036) (180) 102 (10,071) (324) 0 (5,382) (6,116) (2,625) (434) (1,236) (16,117) 235 10,121 (1,848) 9,515 17,788 (4,656) 5,492 (1,907) (6,048) (5,717) (555) (908) (14,299) (69) 1,759 0 7,756 9,515 (53) 15,872 (3,784) (6,102) (7,410) (431) (629) (2,537) (438) 742 0 7,014 7,756 5,271 $ 2,216 3,616 $ 2,464 3,982 $ 2,348 3
Step by Step Solution
There are 3 Steps involved in it

Get step-by-step solutions from verified subject matter experts