

Question: Ratio Formula Calculation Ratio Average Comment Liquidity Current = 3.2x 4.2x Poor Current assets Current liabilities Current assets Inventories Current liabilities $1,000 $310 $385 $310
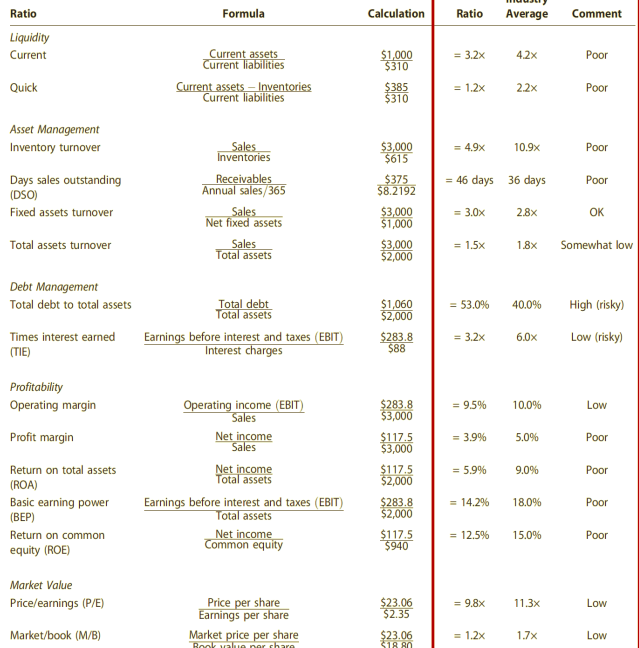
Ratio Formula Calculation Ratio Average Comment Liquidity Current = 3.2x 4.2x Poor Current assets Current liabilities Current assets Inventories Current liabilities $1,000 $310 $385 $310 Quick = 1.2x 2.2x Poor Asset Management Inventory turnover = 49x 10.9x Poor = 46 days 36 days Poor Days sales outstanding (DSO) Fixed assets turnover Sales Inventories Receivables Annual sales/365 Sales Net fixed assets Sales Total assets $3,000 $615 $375 $8.2192 $3,000 $1,000 $3,000 $2,000 - 3.0x 2.8x OK Total assets turnover = 1.5x 1.8x Somewhat low Debt Management Total debt to total assets = 53.0% 40.0% High (risky) Total debt Total assets Earnings before interest and taxes (EBIT) Interest charges $1,060 $2,000 $283.8 $88 = 3.2x 6.0x Times interest earned (TIE) Low (risky) Profitability Operating margin = 9.5% 10.0% Low Profit margin = 3.9% 5.0% Poor Operating income (EBIT) Sales Net income Sales Net income Total assets Earnings before interest and taxes (EBIT) Total assets Net income Common equity = 5.9% 9.0% $283.8 $3,000 $117.5 $3,000 $117.5 $2,000 $283.8 $2,000 $117.5 $940 Poor = 14.2% Return on total assets (ROA) Basic earning power (BEP) Return on common equity (ROE) 18.0% Poor = 12.5% 15.0% Poor Market Value Price/earnings (P/E) = 9.8x 11.3x Low Price per share Earnings per share Market price per share $23.06 $2.35 Market/book (M/B) = 1.2x 1.7x $23.06 $18 Low Rookvalme nar chara Ratio Formula Calculation Ratio Average Comment Liquidity Current = 3.2x 4.2x Poor Current assets Current liabilities Current assets Inventories Current liabilities $1,000 $310 $385 $310 Quick = 1.2x 2.2x Poor Asset Management Inventory turnover = 49x 10.9x Poor = 46 days 36 days Poor Days sales outstanding (DSO) Fixed assets turnover Sales Inventories Receivables Annual sales/365 Sales Net fixed assets Sales Total assets $3,000 $615 $375 $8.2192 $3,000 $1,000 $3,000 $2,000 - 3.0x 2.8x OK Total assets turnover = 1.5x 1.8x Somewhat low Debt Management Total debt to total assets = 53.0% 40.0% High (risky) Total debt Total assets Earnings before interest and taxes (EBIT) Interest charges $1,060 $2,000 $283.8 $88 = 3.2x 6.0x Times interest earned (TIE) Low (risky) Profitability Operating margin = 9.5% 10.0% Low Profit margin = 3.9% 5.0% Poor Operating income (EBIT) Sales Net income Sales Net income Total assets Earnings before interest and taxes (EBIT) Total assets Net income Common equity = 5.9% 9.0% $283.8 $3,000 $117.5 $3,000 $117.5 $2,000 $283.8 $2,000 $117.5 $940 Poor = 14.2% Return on total assets (ROA) Basic earning power (BEP) Return on common equity (ROE) 18.0% Poor = 12.5% 15.0% Poor Market Value Price/earnings (P/E) = 9.8x 11.3x Low Price per share Earnings per share Market price per share $23.06 $2.35 Market/book (M/B) = 1.2x 1.7x $23.06 $18 Low Rookvalme nar chara
Step by Step Solution
There are 3 Steps involved in it

Get step-by-step solutions from verified subject matter experts