

Question: 1. Based on the 2016 data, complete the information in the table below. 2. Then perform the DuPont analysis using the information from the filled-out
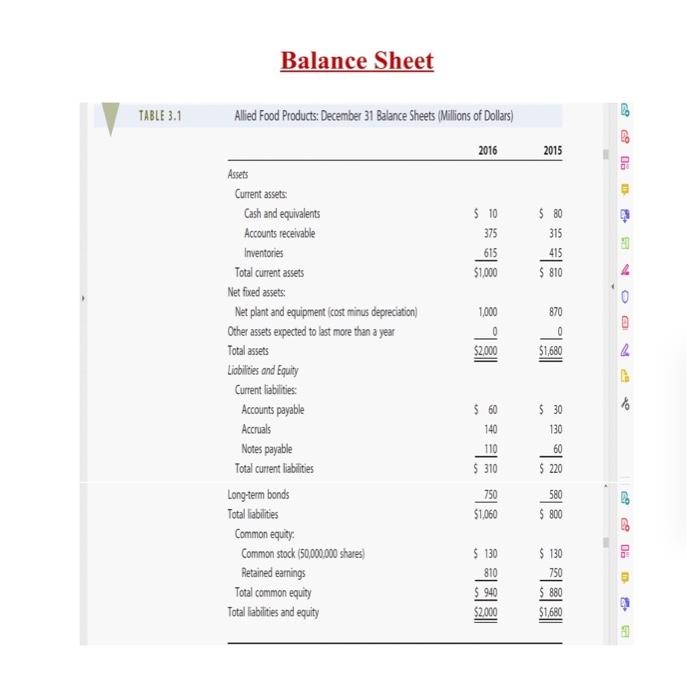
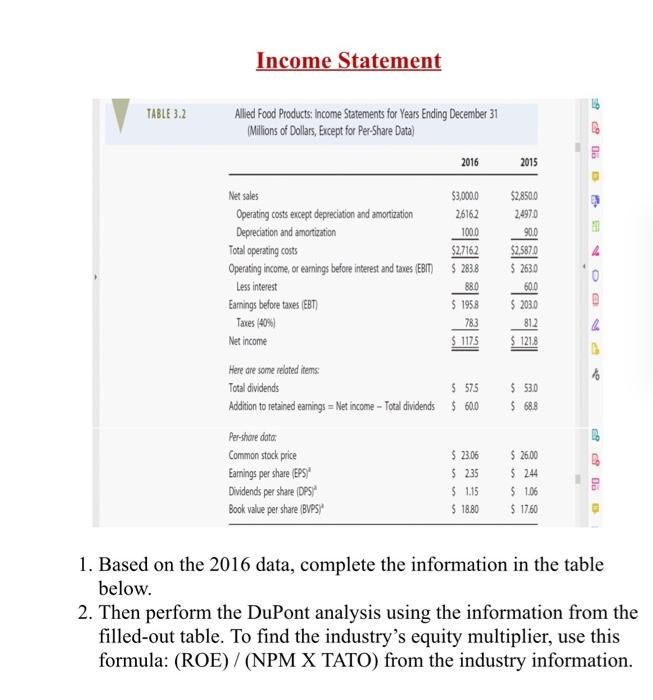
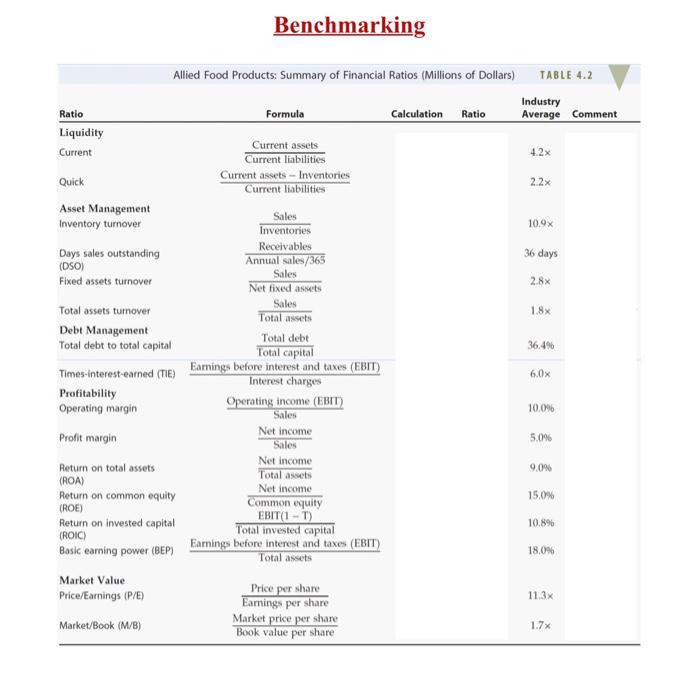
Balance Sheet TABLE 3.1 CO Allied Food Products: December 31 Balance Sheets (Millions of Dollars) 69 2016 2015 . 3 $ 10 375 615 $1,000 $ 80 315 415 $ 810 4 1,000 870 0 0 D 0 $2,000 $1,680 2 Assets Current assets: Cash and equivalents Accounts receivable Inventories Total current assets Net fixed assets: Net plant and equipment (cost minus depreciation) Other assets expected to last more than a year Total assets Liabilities and Equity Current fiabilities: Accounts payable Accruals Notes payable Total current liabilities Long-term bonds Total liabilities Common equity: Common stock (50,000,000 shares Retained earnings Total common equity Total liabilities and equity 40 $ 60 140 $ 30 130 110 60 $ 220 $ 310 750 $1,060 09 580 $ 800 69 $ 130 810 $ 940 $2.000 $ 130 750 $ 880 $1,680 3 Income Statement TABLE 3.2 Allied Food Products: Income Statements for Years Ending December 31 (Millions of Dollars, Except for Per-Share Data) 2016 2015 $2,8500 2.4970 900 $2,5870 $ 263.0 600 783 $ 2030 812 $ 1213 Net sales $3,0000 Operating costs except depreciation and amortization 26162 Depreciation and amortization 1000 Total operating costs $2.7162 Operating income, or earnings before interest and taxes (EBIT) $ 283.8 Less interest 880 Earnings before taxes (EBT $ 1958 Taves (40%) Net income $ 1175 Here are some related items Total dividends $ 575 Addition to retained earnings = Net income - Total dividends $ 600 Per-share data: Common stock price $ 23.06 Earnings per share (EPS) $ 235 Dividends per share (DPS) $ 1.15 Book value per share (BVPS $ 1880 40 $ 53.0 $ 68.8 $26.00 $ 244 $ 1.06 $17.60 C D 1. Based on the 2016 data, complete the information in the table below. 2. Then perform the DuPont analysis using the information from the filled-out table. To find the industry's equity multiplier, use this formula: (ROE) / (NPM X TATO) from the industry information. Benchmarking Allied Food Products: Summary of Financial Ratios (Millions of dollars) TABLE 4.2 Industry Ratio Formula Calculation Ratio Average Comment Liquidity Current assets Current 4.2x Current liabilities Current assets - Inventories Quick 22x Current liabilities Asset Management Sales Inventory turnover 10.9x Inventories Days sales outstanding Receivables 36 days (DSO) Annual sales/365 Sales Fixed assets turnover 2.8% Net fixed assets Sales Total assets turnover 1.8% Total assets Debt Management Total debt to total capital Total debt 36,496 Total capital Times Interest-earned (TIE) Earnings before interest and taxes (EBIT) 6.0% Interest charges Profitability Operating margin Operating income (EBIT) 10.096 Sales Profit margin Net income 5.096 Sales Net income Return on total assets 9.0% Total assets (ROA) Return on common equity Net Income 15,0% (ROE) Common equity Return on invested capital EBIT(1 - 1) 10.8% (ROIC Total invested capital Basic earning power (BEP) Earings before interest and taxes (EBIT) 18.096 Total assets Market Value Price per share Price/Earnings (P/E) 113x Earnings per share Market/Book (M/B) Market price per share 1.7% Book value per share
Step by Step Solution
There are 3 Steps involved in it

Get step-by-step solutions from verified subject matter experts