

Question: Ratios and Financial Planning at SRS Air, Inc. Chris Guthrie was recently hired by S&S Air, Inc., to assist the company with its financial planning
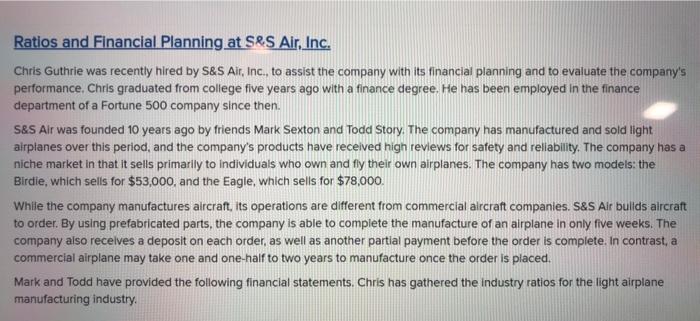
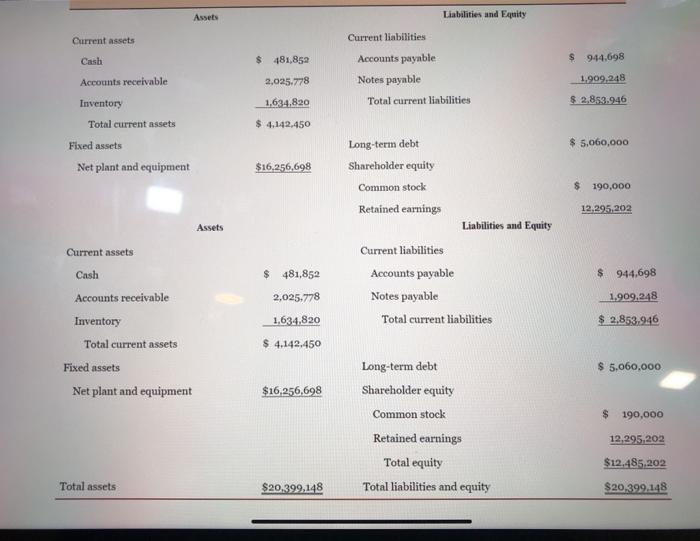
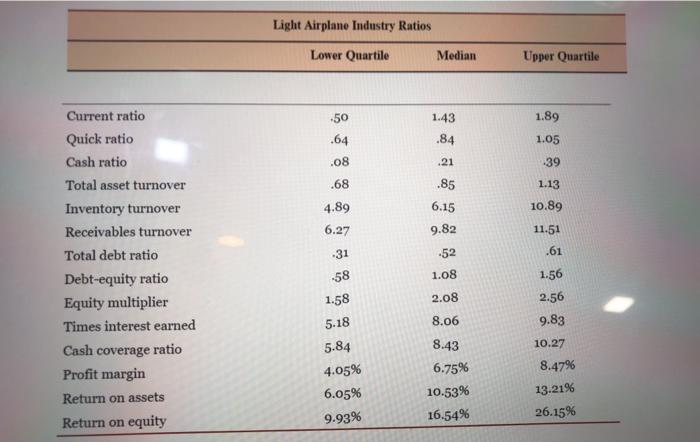
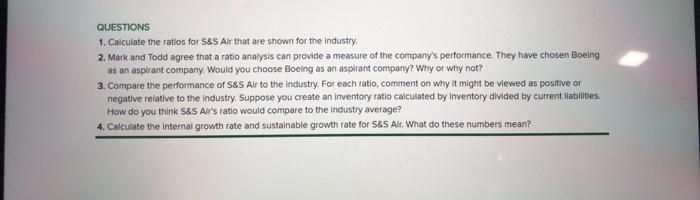
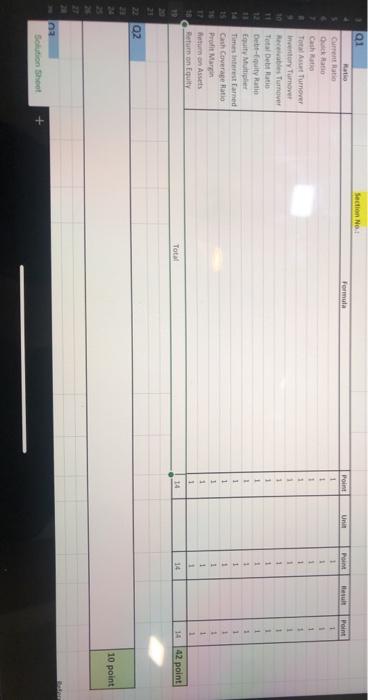
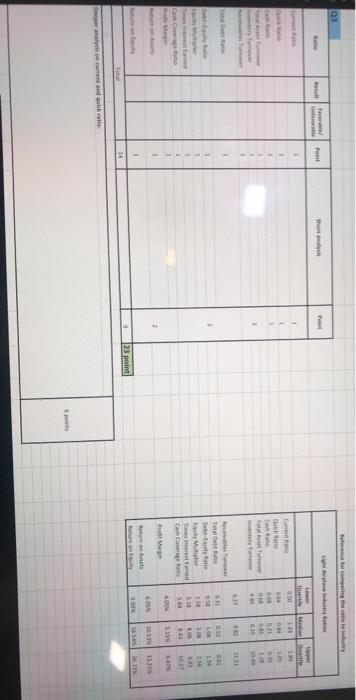
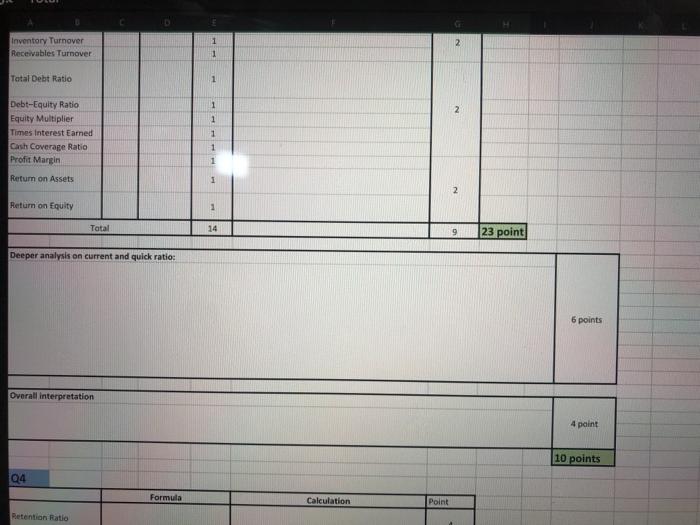
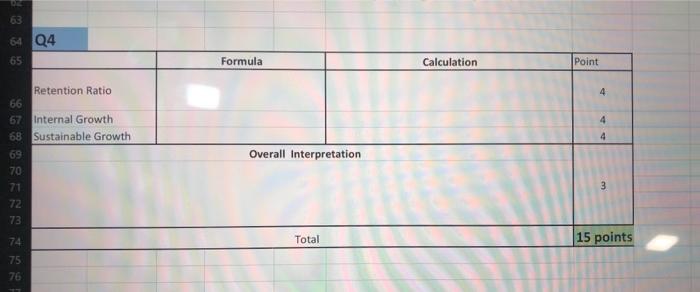
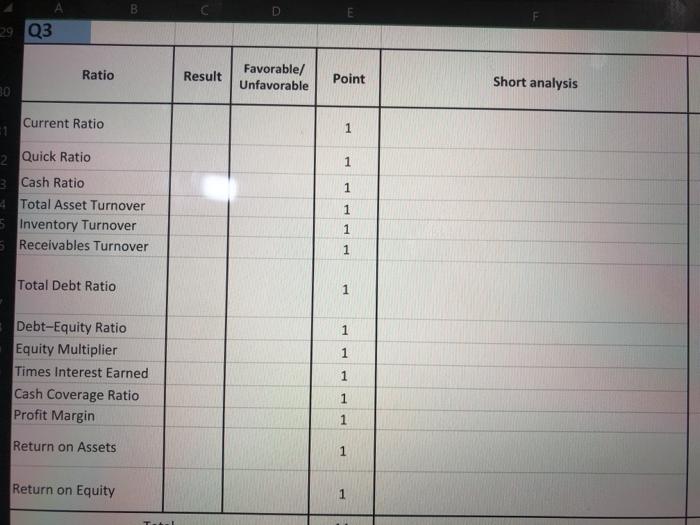
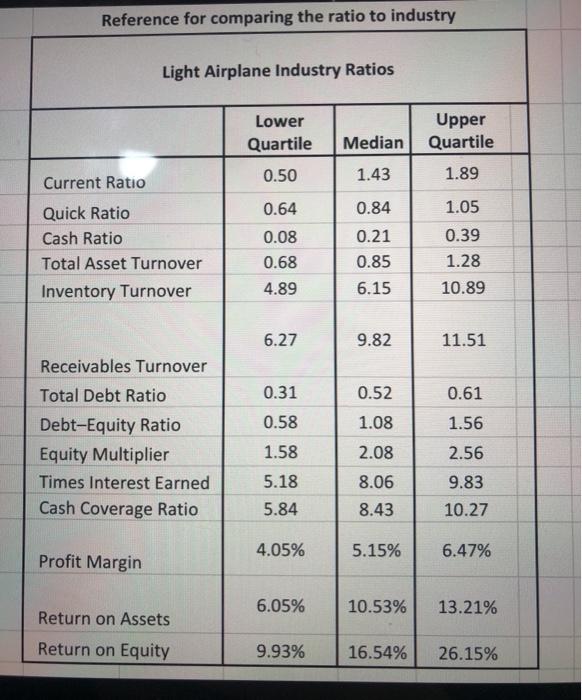
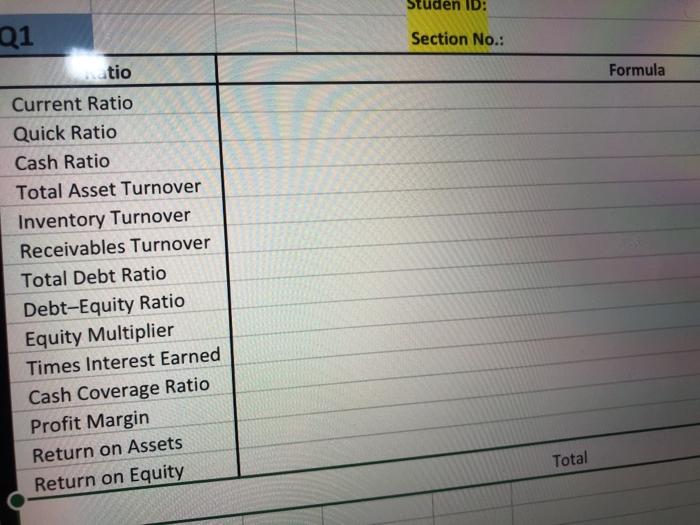
Ratios and Financial Planning at SRS Air, Inc. Chris Guthrie was recently hired by S&S Air, Inc., to assist the company with its financial planning and to evaluate the company's performance. Chris graduated from college five years ago with a finance degree. He has been employed in the finance department of a Fortune 500 company since then. S&S Air was founded 10 years ago by friends Mark Sexton and Todd Story. The company has manufactured and sold light airplanes over this period, and the company's products have received high reviews for safety and reliability. The company has a niche market in that it sells primarily to individuals who own and fly their own airplanes. The company has two models: the Birdie, which sells for $53,000, and the Eagle, which sells for $78,000. While the company manufactures alrcraft, its operations are different from commercial aircraft companies. S&S Air bullds aircraft to order. By using prefabricated parts, the company is able to complete the manufacture of an airplane in only five weeks. The company also receives a deposit on each order, as well as another partial payment before the order is complete. In contrast, a commercial airplane may take one and one-half to two years to manufacture once the order is placed. Mark and Todd have provided the following financial statements. Chris has gathered the industry ratios for the light airplane manufacturing industry. Assets Liabilities and Equity Current assets Current liabilities Cash $ 481,852 $ 944,698 2,025.778 Accounts payable Notes payable Total current liabilities 1,909,248 1,634,820 $ 2,853.946 Accounts receivable Inventory Total current assets Fixed assets Net plant and equipment $.4.142,450 $ 5,060,000 $16.256,698 Long-term debt Shareholder equity Common stock Retained earnings $ 190,000 12.295,202 Assets Liabilities and Equity Current assets Cash $ 481,852 $ 944.698 Current liabilities Accounts payable Notes payable Total current liabilities 2,025.778 1,909,248 $ 2.853.946 1.634.820 Accounts receivable Inventory Total current assets Fixed assets Net plant and equipment $. 4.142.450 $ 5,060,000 $16.256,698 $ 190,000 Long-term debt Shareholder equity Common stock Retained earnings Total equity Total liabilities and equity 12,295,202 $12.485,202 Total assets $20,399,148 $20,399,148 Light Airplane Industry Ratios Lower Quartile Median Upper Quartile -50 1.89 1.43 .84 .64 1.05 .08 .21 39 .68 1.13 .85 6.15 4.89 10.89 11.51 6.27 .61 -31 Current ratio Quick ratio Cash ratio Total asset turnover Inventory turnover Receivables turnover Total debt ratio Debt-equity ratio Equity multiplier Times interest earned Cash coverage ratio Profit margin Return on assets Return on equity 9.82 -52 1.08 1.56 2.08 8.06 -58 1.58 5.18 5.84 4.05% 6.05% 9.93% 8.43 6.75% 10.53% 16.54% 2.56 9.83 10.27 8.47% 13.21% 26.15% QUESTIONS 1. Calculate the ratios for S&S Air that are shown for the Industry 2. Mark and Todd agree that a ratio analysis can provide a measure of the company's performance. They have chosen Boeing as an aspirant company. Would you choose Boeing as an aspitant company? Why or why not? 3. Compare the performance of s&s Air to the industry. For each ratio, comment on why it might be viewed as positive or negative relative to the industry. Suppose you create an Inventory ratio calculated by inventory divided by current liabilities. How do you think S&S Air's ratio would compare to the industry average? 4. Calculate the Internal growth rate and sustainable growth rate for S&S Ait. What do these numbers mean? Section No Formula Un Point Hesult Point Point 1 1 1 1 1 01 ta Current Ratio buck Ratio Cash Total Art Turnover Inventory Turnover Receivable Turnover Total Debt Ratio Debt-Equity Ratio Equity Multiple Time interest rated Cash Coverage Ratio 10 1 1 1 1 1 1 12 11 1 1 1 1 1 1 1 1 1 1 1 1 1 1 1 1 1 1 1 Burnon Coulty 1 Total 14 14 14 42 point 21 22 Q2 10 point 2 Solution Shoot + 03 M . 1 CER BA 1 ro To W LI 2 LIS 1 10 190 Die 1 14 w WS CO 1 1 LOSS tren 1 WO 105 NET 1 Bumus Buy NE 34195 23 point Tot 14 1 2 Inventory Turnover Receivables Turnover 1 Total Debt Ratio 1 1 1 Debt-Equity Ratio Equity Multiplier Times Interest Earned Cash Coverage Ratio Profit Margin 1 1 1 Return on Assets 1 2 Return on Equity 1 Total 14 9 23 point Deeper analysis on current and quick ratio: 6 points Overall interpretation 4 point 10 points Q4 Formula Calculation Point Retention Ratio 63 64 Q4 65 Formula Calculation Point 4 4 4 Retention Ratio 66 67 Internal Growth 68 Sustainable Growth 69 70 21 72 73 Overall Interpretation 3 74 Total 15 points 76 B 29 Q3 Ratio Result Favorable/ Unfavorable Point Short analysis 10 Current Ratio 1 1 1 1 2 Quick Ratio 3 Cash Ratio 4 Total Asset Turnover 5 Inventory Turnover 5 Receivables Turnover 1 1 Total Debt Ratio 1 1 1 Debt-Equity Ratio Equity Multiplier Times Interest Earned Cash Coverage Ratio Profit Margin 1 1 1 Return on Assets 1 Return on Equity 1 Reference for comparing the ratio to industry Light Airplane Industry Ratios Lower Quartile Upper Quartile Median 0.50 1.43 1.89 Current Ratio 1.05 Quick Ratio Cash Ratio Total Asset Turnover Inventory Turnover 0.64 0.08 0.68 4.89 0.84 0.21 0.85 6.15 0.39 1.28 10.89 6.27 9.82 11.51 0.31 0.52 0.61 0.58 1.08 1.56 Receivables Turnover Total Debt Ratio Debt-Equity Ratio Equity Multiplier Times Interest Earned Cash Coverage Ratio 1.58 2.08 2.56 8.06 5.18 5.84 9.83 10.27 8.43 4.05% 5.15% 6.47% Profit Margin 6.05% 10.53% 13.21% Return on Assets Return on Equity 9.93% 16.54% 26.15% studen ID: Q1 Section No.: Formula natio Current Ratio Quick Ratio Cash Ratio Total Asset Turnover Inventory Turnover Receivables Turnover Total Debt Ratio Debt-Equity Ratio Equity Multiplier Times Interest Earned Cash Coverage Ratio Profit Margin Return on Assets Return on Equity Total Point Unit Point Result 1 1 Point 1 1 1 1 1 1 1 1 1 1 1 1 1 1 1 1 1 1 1 1 1 1 1 1 1 1 1 1 1 1 1 1 1 1 1 1 1 1 1 1 1 1 14 4 14 14 Ratios and Financial Planning at SRS Air, Inc. Chris Guthrie was recently hired by S&S Air, Inc., to assist the company with its financial planning and to evaluate the company's performance. Chris graduated from college five years ago with a finance degree. He has been employed in the finance department of a Fortune 500 company since then. S&S Air was founded 10 years ago by friends Mark Sexton and Todd Story. The company has manufactured and sold light airplanes over this period, and the company's products have received high reviews for safety and reliability. The company has a niche market in that it sells primarily to individuals who own and fly their own airplanes. The company has two models: the Birdie, which sells for $53,000, and the Eagle, which sells for $78,000. While the company manufactures alrcraft, its operations are different from commercial aircraft companies. S&S Air bullds aircraft to order. By using prefabricated parts, the company is able to complete the manufacture of an airplane in only five weeks. The company also receives a deposit on each order, as well as another partial payment before the order is complete. In contrast, a commercial airplane may take one and one-half to two years to manufacture once the order is placed. Mark and Todd have provided the following financial statements. Chris has gathered the industry ratios for the light airplane manufacturing industry. Assets Liabilities and Equity Current assets Current liabilities Cash $ 481,852 $ 944,698 2,025.778 Accounts payable Notes payable Total current liabilities 1,909,248 1,634,820 $ 2,853.946 Accounts receivable Inventory Total current assets Fixed assets Net plant and equipment $.4.142,450 $ 5,060,000 $16.256,698 Long-term debt Shareholder equity Common stock Retained earnings $ 190,000 12.295,202 Assets Liabilities and Equity Current assets Cash $ 481,852 $ 944.698 Current liabilities Accounts payable Notes payable Total current liabilities 2,025.778 1,909,248 $ 2.853.946 1.634.820 Accounts receivable Inventory Total current assets Fixed assets Net plant and equipment $. 4.142.450 $ 5,060,000 $16.256,698 $ 190,000 Long-term debt Shareholder equity Common stock Retained earnings Total equity Total liabilities and equity 12,295,202 $12.485,202 Total assets $20,399,148 $20,399,148 Light Airplane Industry Ratios Lower Quartile Median Upper Quartile -50 1.89 1.43 .84 .64 1.05 .08 .21 39 .68 1.13 .85 6.15 4.89 10.89 11.51 6.27 .61 -31 Current ratio Quick ratio Cash ratio Total asset turnover Inventory turnover Receivables turnover Total debt ratio Debt-equity ratio Equity multiplier Times interest earned Cash coverage ratio Profit margin Return on assets Return on equity 9.82 -52 1.08 1.56 2.08 8.06 -58 1.58 5.18 5.84 4.05% 6.05% 9.93% 8.43 6.75% 10.53% 16.54% 2.56 9.83 10.27 8.47% 13.21% 26.15% QUESTIONS 1. Calculate the ratios for S&S Air that are shown for the Industry 2. Mark and Todd agree that a ratio analysis can provide a measure of the company's performance. They have chosen Boeing as an aspirant company. Would you choose Boeing as an aspitant company? Why or why not? 3. Compare the performance of s&s Air to the industry. For each ratio, comment on why it might be viewed as positive or negative relative to the industry. Suppose you create an Inventory ratio calculated by inventory divided by current liabilities. How do you think S&S Air's ratio would compare to the industry average? 4. Calculate the Internal growth rate and sustainable growth rate for S&S Ait. What do these numbers mean? Section No Formula Un Point Hesult Point Point 1 1 1 1 1 01 ta Current Ratio buck Ratio Cash Total Art Turnover Inventory Turnover Receivable Turnover Total Debt Ratio Debt-Equity Ratio Equity Multiple Time interest rated Cash Coverage Ratio 10 1 1 1 1 1 1 12 11 1 1 1 1 1 1 1 1 1 1 1 1 1 1 1 1 1 1 1 Burnon Coulty 1 Total 14 14 14 42 point 21 22 Q2 10 point 2 Solution Shoot + 03 M . 1 CER BA 1 ro To W LI 2 LIS 1 10 190 Die 1 14 w WS CO 1 1 LOSS tren 1 WO 105 NET 1 Bumus Buy NE 34195 23 point Tot 14 1 2 Inventory Turnover Receivables Turnover 1 Total Debt Ratio 1 1 1 Debt-Equity Ratio Equity Multiplier Times Interest Earned Cash Coverage Ratio Profit Margin 1 1 1 Return on Assets 1 2 Return on Equity 1 Total 14 9 23 point Deeper analysis on current and quick ratio: 6 points Overall interpretation 4 point 10 points Q4 Formula Calculation Point Retention Ratio 63 64 Q4 65 Formula Calculation Point 4 4 4 Retention Ratio 66 67 Internal Growth 68 Sustainable Growth 69 70 21 72 73 Overall Interpretation 3 74 Total 15 points 76 B 29 Q3 Ratio Result Favorable/ Unfavorable Point Short analysis 10 Current Ratio 1 1 1 1 2 Quick Ratio 3 Cash Ratio 4 Total Asset Turnover 5 Inventory Turnover 5 Receivables Turnover 1 1 Total Debt Ratio 1 1 1 Debt-Equity Ratio Equity Multiplier Times Interest Earned Cash Coverage Ratio Profit Margin 1 1 1 Return on Assets 1 Return on Equity 1 Reference for comparing the ratio to industry Light Airplane Industry Ratios Lower Quartile Upper Quartile Median 0.50 1.43 1.89 Current Ratio 1.05 Quick Ratio Cash Ratio Total Asset Turnover Inventory Turnover 0.64 0.08 0.68 4.89 0.84 0.21 0.85 6.15 0.39 1.28 10.89 6.27 9.82 11.51 0.31 0.52 0.61 0.58 1.08 1.56 Receivables Turnover Total Debt Ratio Debt-Equity Ratio Equity Multiplier Times Interest Earned Cash Coverage Ratio 1.58 2.08 2.56 8.06 5.18 5.84 9.83 10.27 8.43 4.05% 5.15% 6.47% Profit Margin 6.05% 10.53% 13.21% Return on Assets Return on Equity 9.93% 16.54% 26.15% studen ID: Q1 Section No.: Formula natio Current Ratio Quick Ratio Cash Ratio Total Asset Turnover Inventory Turnover Receivables Turnover Total Debt Ratio Debt-Equity Ratio Equity Multiplier Times Interest Earned Cash Coverage Ratio Profit Margin Return on Assets Return on Equity Total Point Unit Point Result 1 1 Point 1 1 1 1 1 1 1 1 1 1 1 1 1 1 1 1 1 1 1 1 1 1 1 1 1 1 1 1 1 1 1 1 1 1 1 1 1 1 1 1 1 1 14 4 14 14
Step by Step Solution
There are 3 Steps involved in it

Get step-by-step solutions from verified subject matter experts