

Question: Ratios Compared with Industry Averages Because you own the common stock of Phantom Corporation, a paper manufacturer, you decide to analyze the firm's performance
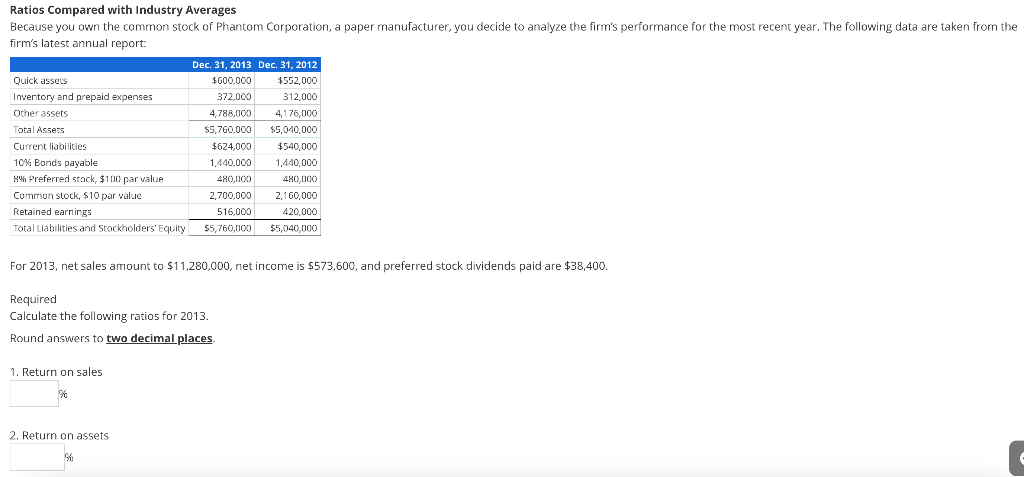
Ratios Compared with Industry Averages Because you own the common stock of Phantom Corporation, a paper manufacturer, you decide to analyze the firm's performance for the most recent year. The following data are taken from the firm's latest annual report: Quick assets Inventory and prepaid expenses Other assets Total Assets Dec. 31, 2013 Dec. 31, 2012 $600,000 $552,000 372,000 312,000 4,788,000 4,176,000 $5,760,000 $5,040,000 Current liabilities $624,000 $540,000 10% Bonds payable 1,440,000 1,440,000 8% Preferred stock, $100 par value 480,000 480,000 Common stock, $10 par value 2,700,000 2,160,000 Retained earnings Total Liabilities and Stockholders' Equity 516,000 $5,760,000 420,000 $5,040,000 For 2013, net sales amount to $11,280,000, net income is $573,600, and preferred stock dividends paid are $38,400. Required Calculate the following ratios for 2013. Round answers to two decimal places. 1. Return on sales % 2. Return on assets %
Step by Step Solution
There are 3 Steps involved in it

Get step-by-step solutions from verified subject matter experts