

Question: Read and complete the first case study from our Business Analytics eText. Your case study will require you to demonstrate your understanding and application
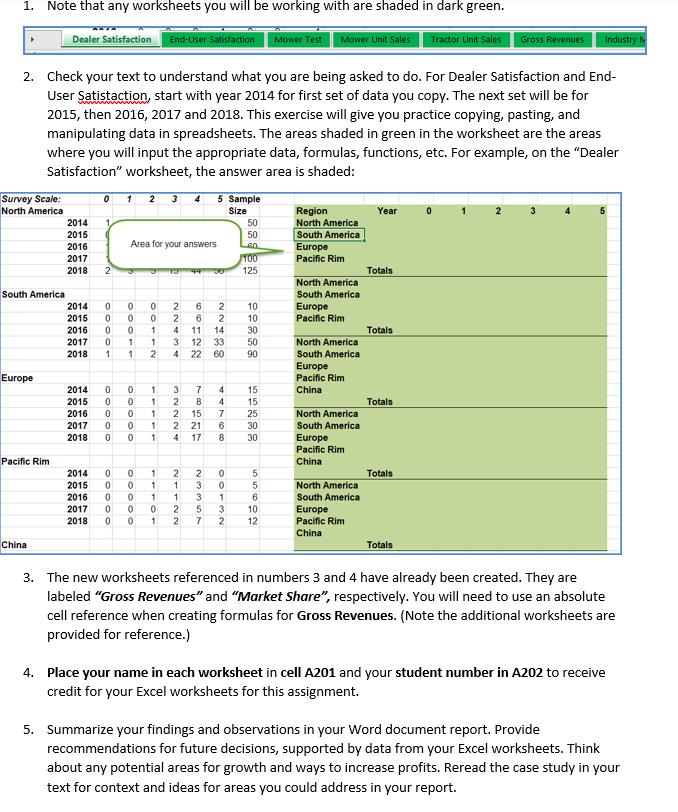
Read and complete the first case study from our Business Analytics eText. Your case study will require you to demonstrate your understanding and application of business analytics concepts. You will be asked to complete Excel functions and tasks and answer questions from the text. Some of the numbers listed in your text will be different from the file provided to you. Use the file provided in the Content area of our course, week 3, Case Study Assignment 1 Excel File. Worth 50 points, your case study will explore concepts covered in Weeks 1, 2 and 3 and encourage critical analysis. Your case study will ask for opinions and recommendations. Your claims should be supported by evidence including references from the text, valid outside resources, or rational arguments. Your case study should exhibit strong structure and organization. A concise introduction with a clear preview, a well-written body using complete sentences, in-text citations when necessary and a clear summary in the conclusion are expected. Excel functions you will use include SUM, division, multiplication, COUNTIF, copy and pasting, Gross Sales are overall sales unadjusted for costs, and Market Share (corporation total sales/ industry total sales). You will also need to use filtering and sorting. Aside from just describing the analysis, discuss your interpretation of the data. You may include images from your analysis in the report, but images should not constitute the majority of the report. If you use a table or image, you must spend some time discussing it within the body of the text. A good rule of thumb is at least a paragraph of text to describe each image. College-level writing is expected, points will be deducted for grammar and spelling errors. Include and upload your accompanying Excel file. Your submission must be in APA format. Include a title page with your name, case study title, and date. Your report should be at least 2 full pages, 1-inch margins 12-point Times New Roman font, double-spaced. References and citations must be provided. Your Reference List should be provided at the end of your paper. Your report should be submitted in Word (.docx) format. Information for downloading MS Office 2016 for free is provided in the "Start Here" module. Please refer to the Case Study Assignment tab in the Assignment Overview module for a copy of the rubric for evaluation of your Case Study. Your submitted Excel file will be evaluated under the Content section of the rubric. Make sure you complete each of the tasks listed in your eText for PLE Case Study 1. Here are some details you need to complete the file. 1. Note that any worksheets you will be working with are shaded in dark green. Survey Scale: North America South America 2. Check your text to understand what you are being asked to do. For Dealer Satisfaction and End- User Satistaction, start with year 2014 for first set of data you copy. The next set will be for 2015, then 2016, 2017 and 2018. This exercise will give you practice copying, pasting, and manipulating data in spreadsheets. The areas shaded in green in the worksheet are the areas where you will input the appropriate data, formulas, functions, etc. For example, on the "Dealer Satisfaction" worksheet, the answer area is shaded: Europe Pacific Rim Dealer Satisfaction End-User Satisfaction Mower Test Mower Unit Sales Tractor Unit Sales China 2014 2015 2016 2017 2018 0 2 0 2014 2015 0 2016 0 2017 0 2018 2014 0 2015 0 2016 0 2017 0 2018 0 oooo 0 1 2 3 4 5 Sample Size Area for your answers Ooo 3 0 1 1 1 2 4000 00000 J 13 00000 1100 22434 1 3 1 2 1 1 1 ANNNW 2014 2015 0 2016 2017 0 2018 0 0 1 2 2 66122 22438 76717 2 21 1 1 0 2 8 15 30 3 5 1 2 2 0 1 1 7 14 10 10 30 33 50 90 60 447600 3 0 8 50 50 Lea 1 3 2 100 125 15 15 25 30 30 55602 10 12 Region North America South America Europe Pacific Rim North America South America Europe Pacific Rim North America South America Europe Pacific Rim China North America South America Europe Pacific Rim China North America South America Europe Pacific Rim China Year Totals Totals Totals Totals Totals Gross Revenues 0 Industry N 5 1 H 3. The new worksheets referenced in numbers 3 and 4 have already been created. They are labeled "Gross Revenues" and "Market Share", respectively. You will need to use an absolute cell reference when creating formulas for Gross Revenues. (Note the additional worksheets are provided for reference.) 4. Place your name in each worksheet in cell A201 and your student number in A202 to receive credit for your Excel worksheets for this assignment. 5. Summarize your findings and observations in your Word document report. Provide recommendations for future decisions, supported by data from your Excel worksheets. Think about any potential areas for growth and ways to increase profits. Reread the case study in your text for context and ideas for areas you could address in your report.
Step by Step Solution
3.50 Rating (150 Votes )
There are 3 Steps involved in it
Case Study Report Demand Forecasting at Precision Lawn Equipment Introduction This case study analyzes sales data from Precision Lawn Equipment PLE to ... View full answer

Get step-by-step solutions from verified subject matter experts