

Question: Read the following case study and answer this question: Assuming you're the CEO of this company. How can you handle the situation? Identify the case's
Read the following case study and answer this question: Assuming you're the CEO of this company. How can you handle the situation? Identify the case's issue and provide the solutions.
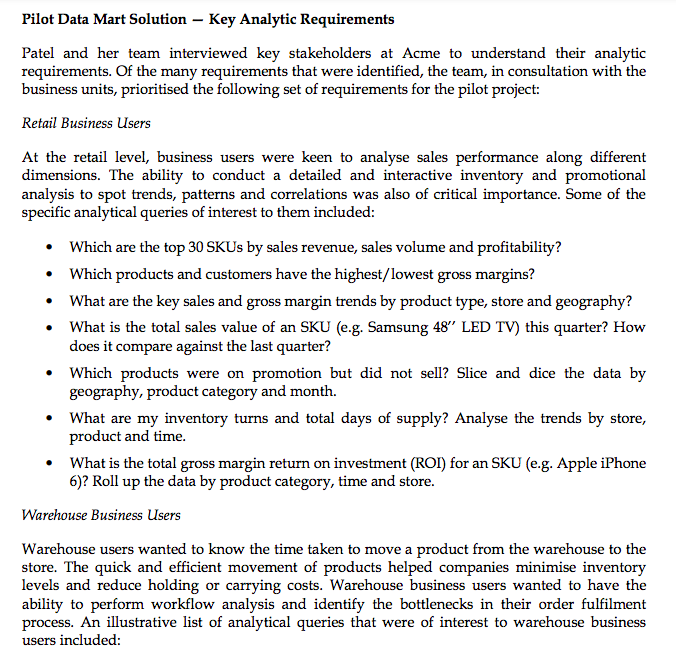
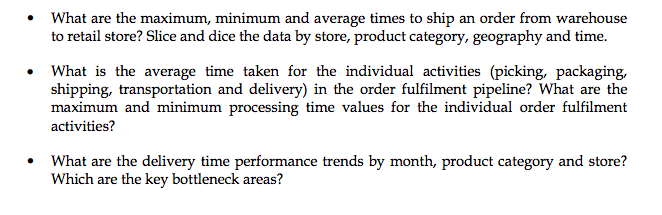
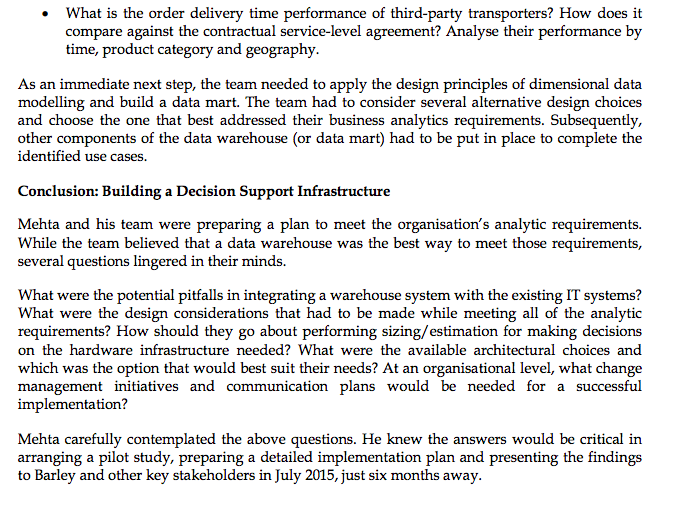
It was January 15, 2015, and Vishal Mehta, Chief Information Officer of Acme Inc., an Indian retailer of consumer electronic and durable goods, had just wrapped up a meeting with Steve Barley, Vice President (Retail), and several other key regional and national heads of Acme. The team discussed the company's plans for the year ahead and the key decision support infrastructure woes faced by operational units in data access, integration, analysis, usage and interpretation. Mehta presented his ideas on how a data warehouse investment could help address many of these decision support infrastructure challenges. The management was quite receptive to his ideas and asked him to conduct a feasibility study, build a pilot and prepare a detailed implementation plan. Mehta had more than 15 years of experience successfully building and managing a number of IT projects. However, he lacked sufficient expertise in business intelligence (BI) or data warehouse (DW)-related projects. BI/DW projects were more challenging to execute than normal IT projects and required organisation-wide commitment and support. Mehta, therefore, was contemplating how to build a data warehouse solution to meet his organisation's business requirements. About Acme Inc Acme Inc. was one of the leading national retail chains in India. The company had over 150 stores spread across nine major states and 24 key cities with floor areas ranging from 15,000 to 24,000 square feet. It was a specialist retailer in the consumer electronics and durables market. A 2012 industry report had projected that the consumer electronics and durable market in India would reach INR 520 billion by 2015 at a compounded annual growth rate (CAGR) of 15%1 By 2013, the company had become one of the major players in the Indian market with a market share of 1820% and INR 33 billion (3,300 crores) in sales revenue. Acme's stores offered its customers merchandise in a variety of branded and non-branded categories - computers, tablets, cameras, home appliances, kitchen appliances, gaming, and so on. Each store stocked about 12,000 stock keeping units (SKUs) or products, 180 brands, and nine major product categories. The company had also established an online presence, selling its Store Operations Acme's store operations involved a number of activities including indenting, inventory handling, customer service, workforce allocation and management. These activities were coordinated by a store manager and executed by sales assistants and other employees. The store manager replenished the items in the inventory by placing orders to the regional warehouse. The actual quantity of items to be ordered, including adjustments for lot sizes, were automatically determined by an information system using standard inventory models (e.g., economic order quantity or EOQ). The store manager raised an indent when the store product inventory reached its reorder limit. To synchronise activities across stores and a regional warehouse, the organisation followed a policy of indenting once a week on specific days. The store manager also raised indents on an ad-hoc basis for specific items, especially when there was a sudden surge in sales and the item stocked out. Store employees handled the shipments received from the regional warehouse. These shipments were first stored in a local storeroom. The items in the container (i.e., cartons, pallets or bags) were then unpacked to retrieve individual product SKUs. The products were then moved to the store locations and placed according to the store's planogram design (or floor plan). These planograms were generally prepared by merchandising managers, who analysed numerous variables such as customer purchase histories, demand patterns, local demographics, customer survey ratings, and so on. Merchandising managers often sought inputs from the local store managers to come up with better floor plans to improve the store's profitability. One of the responsibilities of the store manager was to ensure that the products were stocked as per the planogram design. Store employees restocked items at store locations by following the planogram design. Store assistants maintained the aesthetic appeal of the items by cleaning them and placing or orienting them correctly after a customer visit. Each store conducted a physical verification of its inventory once in two weeks and reconciled discrepancies in physical and actual inventory. Discrepancies could occur for a number of reasons, such as employee theft, shoplifting, misplaced goods, billing errors, administrative errors, damage during in-store material handling, expired product shelf life and so on. These discrepancies (commonly referred to as shrinkage in the industry) accounted for 1.21.5% of Acme's total sales. The company aimed to reduce this percentage to about 0.6% over the next three years. Customer service was another important area of store operations. This included activities like handling in-store customer queries, assisting customers in identifying and selecting the right products, processing customer orders, addressing customer complaints and handling product returns. Effective handling of these activities was of utmost importance to Acme, and particularly to each of its store managers, in providing the best in-store experience to their customers. points where data could be collected. Acme collected sales data at the POS terminals, item receipt data for items received from the regional warehouse, physical store inventory information, and periodic customer survey reports. (See Exhibit 1 for a sample invoice that describes the nature of data collected at POS terminals). Warehouse Management The company built a network of regional warehouses to cater to the individual store requirements in the region. The primary warehouse activities included storage management and distribution, inventory management, liaising with raw material suppliers and manufacturers for item procurement, and liaising with transporters for proper and on-time delivery of shipments. As part of its distribution activities, each warehouse shipped items to a set of stores within its region. Typically, stores sent their requests for items or products to their regional warehouse in the form of an indent. The regional warehouse then prepared a pick list based on the indent, did the necessary packaging, and transported the items to the stores in delivery trucks/ vans. The warehouse coordinated with its transport service providers on the shipping of items and tracking shipments to ensure their timely delivery. The company followed a weekly indent policy to synchronise various warehouse activities. Each warehouse received its supplies from multiple manufacturers on a periodic basis. The quantity and periodicity of order placement was determined based on forecast estimates made by the warehouse managers. Warehouse managers closely worked with manufacturers to identify the right products for specific regions, providing customer feedback and making sales data available to facilitate better production planning at the manufacturer's end. There were several areas in which the company was trying to make improvements. First, the forecast estimates were often inaccurate, deviating as much as 3040% for some SKUs. This resulted in excess inventory in a few cases and stock-outs in most other cases. Second, there were frequent complaints from retailers over delayed shipments. Third, there had been many instances in which items had been damaged. This typically occurred during product shipment or material handling inside the warehouse, leading to increased shrinkage. The company was unable to clearly identify the root cause of the problem or bottleneck to take concrete actions to improve the situation. Information Technology Systems at Acme Inc. Historically, the company had grown through acquisitions. For example, in 2012, the company acquired a large distribution warehouse company with operations in multiple towns and cities in India. As a result of this inorganic growth strategy, business processes and IT systems at Acme were highly heterogeneous. A few operating units (retail stores and regional warehouses) used Enterprise Resource Planning (ERP) software as part of their order and inventory management processes; however, there were multiple ERP vendor solutions in different units. Even in units with the same ERP vendor solutions, their configurations were very different. Each of the company's stores and regional warehouses used a relational database to maintain operational data generated from their business processes. The individual units used different relational database products, and possibly different versions and/or configurations of the database products. While there were many differences in the way the data was stored, the underlying database design could be understood using an entity-relationship (ER) diagram. (The ER diagram shown in Exhibit 2 gives a partial view of how different entities pertinent to Acme's business were related and the nature of their relationships). The heterogeneity of IT systems at the hardware, system software, business application and data levels made it extremely difficult for Acme managers to get timely, relevant and accurate information for making better decisions. For example, information about the movement of products across the Acme supply chain was available in multiple systems. However, accessing the information from these systems in a timely manner to determine supply chain operational efficiency improvement was a daunting task. Pilot Data Mart Solution - Key Analytic Requirements Patel and her team interviewed key stakeholders at Acme to understand their analytic requirements. Of the many requirements that were identified, the team, in consultation with the business units, prioritised the following set of requirements for the pilot project: Retail Business Users At the retail level, business users were keen to analyse sales performance along different dimensions. The ability to conduct a detailed and interactive inventory and promotional analysis to spot trends, patterns and correlations was also of critical importance. Some of the specific analytical queries of interest to them included: - Which are the top 30 SKUs by sales revenue, sales volume and profitability? - Which products and customers have the highest/lowest gross margins? - What are the key sales and gross margin trends by product type, store and geography? - What is the total sales value of an SKU (e.g. Samsung 48' LED TV) this quarter? How does it compare against the last quarter? - Which products were on promotion but did not sell? Slice and dice the data by geography, product category and month. - What are my inventory turns and total days of supply? Analyse the trends by store, product and time. - What is the total gross margin return on investment (ROI) for an SKU (e.g. Apple iPhone 6)? Roll up the data by product category, time and store. Warehouse Business Users Warehouse users wanted to know the time taken to move a product from the warehouse to the store. The quick and efficient movement of products helped companies minimise inventory levels and reduce holding or carrying costs. Warehouse business users wanted to have the ability to perform workflow analysis and identify the bottlenecks in their order fulfilment process. An illustrative list of analytical queries that were of interest to warehouse business users included: - What are the maximum, minimum and average times to ship an order from warehouse to retail store? Slice and dice the data by store, product category, geography and time. - What is the average time taken for the individual activities (picking, packaging, shipping, transportation and delivery) in the order fulfilment pipeline? What are the maximum and minimum processing time values for the individual order fulfilment activities? - What are the delivery time performance trends by month, product category and store? Which are the key bottleneck areas? - What is the order delivery time performance of third-party transporters? How does it compare against the contractual service-level agreement? Analyse their performance by time, product category and geography. As an immediate next step, the team needed to apply the design principles of dimensional data modelling and build a data mart. The team had to consider several alternative design choices and choose the one that best addressed their business analytics requirements. Subsequently, other components of the data warehouse (or data mart) had to be put in place to complete the identified use cases. Conclusion: Building a Decision Support Infrastructure Mehta and his team were preparing a plan to meet the organisation's analytic requirements. While the team believed that a data warehouse was the best way to meet those requirements, several questions lingered in their minds. What were the potential pitfalls in integrating a warehouse system with the existing IT systems? What were the design considerations that had to be made while meeting all of the analytic requirements? How should they go about performing sizing/estimation for making decisions on the hardware infrastructure needed? What were the available architectural choices and which was the option that would best suit their needs? At an organisational level, what change management initiatives and communication plans would be needed for a successful implementation? Mehta carefully contemplated the above questions. He knew the answers would be critical in arranging a pilot study, preparing a detailed implementation plan and presenting the findings to Barley and other key stakeholders in July 2015, just six months away
Step by Step Solution
There are 3 Steps involved in it

Get step-by-step solutions from verified subject matter experts