

Question: Read the Improve phase of the MSD Purchasing case study below and answer the following questions. 1. (15 points) A Pareto plot using the data
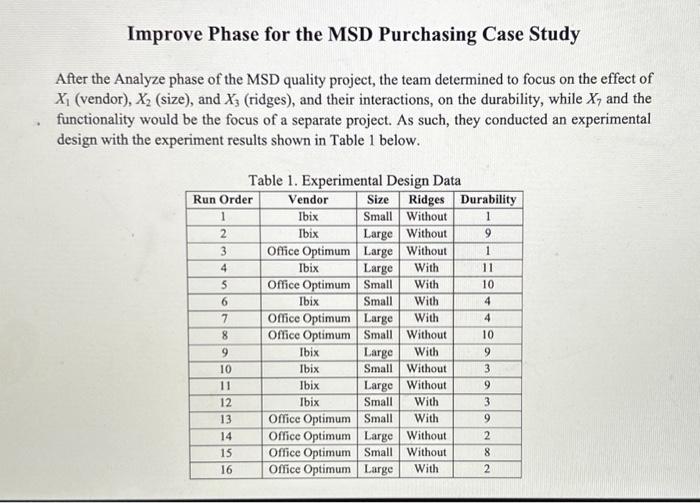
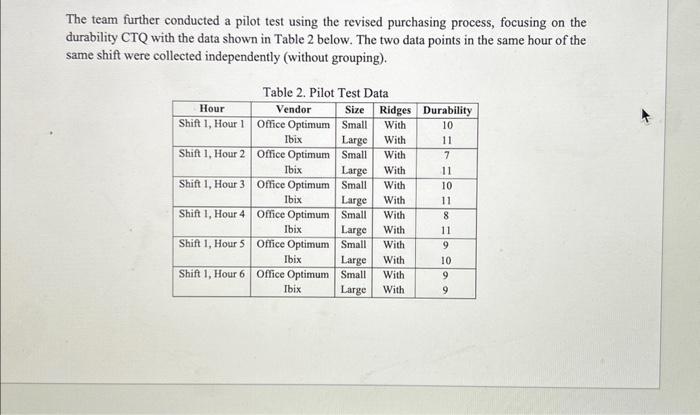
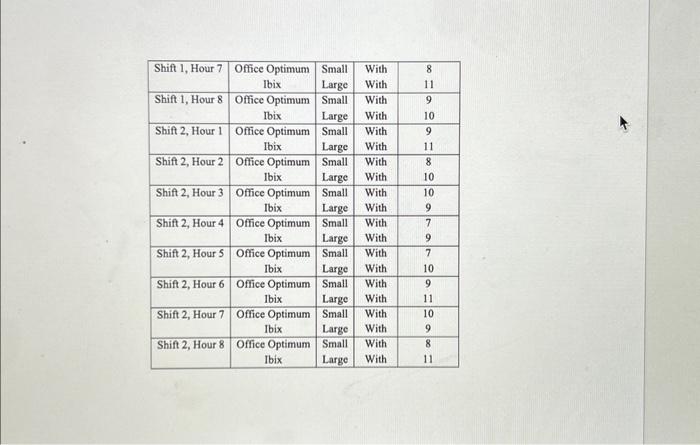
Read the Improve phase of the MSD Purchasing case study below and answer the following questions. 1. (15 points) A Pareto plot using the data provided in Table 1 shows that the major effects for the durability are the interaction of vendor and size and the main effect due to ridges. Create an interaction plot for vendor and size and a main effects plot for ridges, and analyze how the team should make the purchasing decision based on the vendor, size, and ridges. 2. (15 points) Create a control chart using the data provided in Table 2. Study the help menu of Minitab unde "Assistant > Control Charts," and explain why we need to choose an I-MR chart for this data. Based on the control chart generated, explain whether the revised purchasing process is in control and why. Further, explain if the revised process is capable or not based on the data in the pilot test. After the Analyze phase of the MSD quality project, the team determined to focus on the effect of X1 (vendor), X2 (size), and X3 (ridges), and their interactions, on the durability, while X7 and the functionality would be the focus of a separate project. As such, they conducted an experimental design with the experiment results shown in Table 1 below. Tahle 1 Fvnarimantal Nocian Nata The team further conducted a pilot test using the revised purchasing process, focusing on the durability CTQ with the data shown in Table 2 below. The two data points in the same hour of the same shift were collected independently (without grouping)
Step by Step Solution
There are 3 Steps involved in it

Get step-by-step solutions from verified subject matter experts