

Question: The table below shows the number of absences, x, in a Statistics course and the final exam grade, y, for 8 students. 4 3
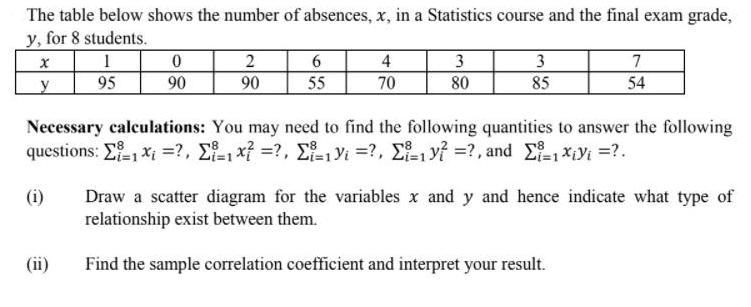
The table below shows the number of absences, x, in a Statistics course and the final exam grade, y, for 8 students. 4 3 3 7 95 90 90 55 70 80 85 54 Necessary calculations: You may need to find the following quantities to answer the following questions: E-, xi =?, E-1 x =?, E-1 yi =?, E-1 y =?, and E-1xiyi =?. (i) Draw a scatter diagram for the variables x and y and hence indicate what type of relationship exist between them. (ii) Find the sample correlation coefficient and interpret your result.
Step by Step Solution
3.41 Rating (148 Votes )
There are 3 Steps involved in it
x i y i x i 2 y i 2 x i yi 1 95 1 9025 95 0 90 0 8100 0 2 90 4 8100 ... View full answer

Get step-by-step solutions from verified subject matter experts