

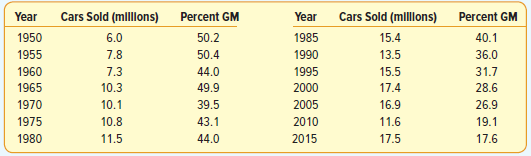
The table below shows the number of cars (in millions) sold in the United States for various
Question:
various years and the percent of those cars manufactured by GM.
Use a statistical software package to answer the following questions.
a. Is the number of cars sold directly or indirectly related to GM€™s percentage of the market? Draw a scatter diagram to show your conclusion.
b. Determine the correlation coefficient between the two variables. Interpret the value.
c. Is it reasonable to conclude that there is a negative association between the two variables? Use the .01 significance level.
d. How much of the variation in GM€™s market share is accounted for by the variation in cars sold?
Fantastic news! We've Found the answer you've been seeking!
Step by Step Answer:
a The sales volume is inversely related to their mark...View the full answer

Answered By
Branice Buyengo Ajevi
I have been teaching for the last 5 years which has strengthened my interaction with students of different level.
1+ Reviews
10+ Question Solved
Related Book For 

Statistical Techniques in Business and Economics
ISBN: 978-1259666360
17th edition
Authors: Douglas A. Lind, William G Marchal
Question Posted:
