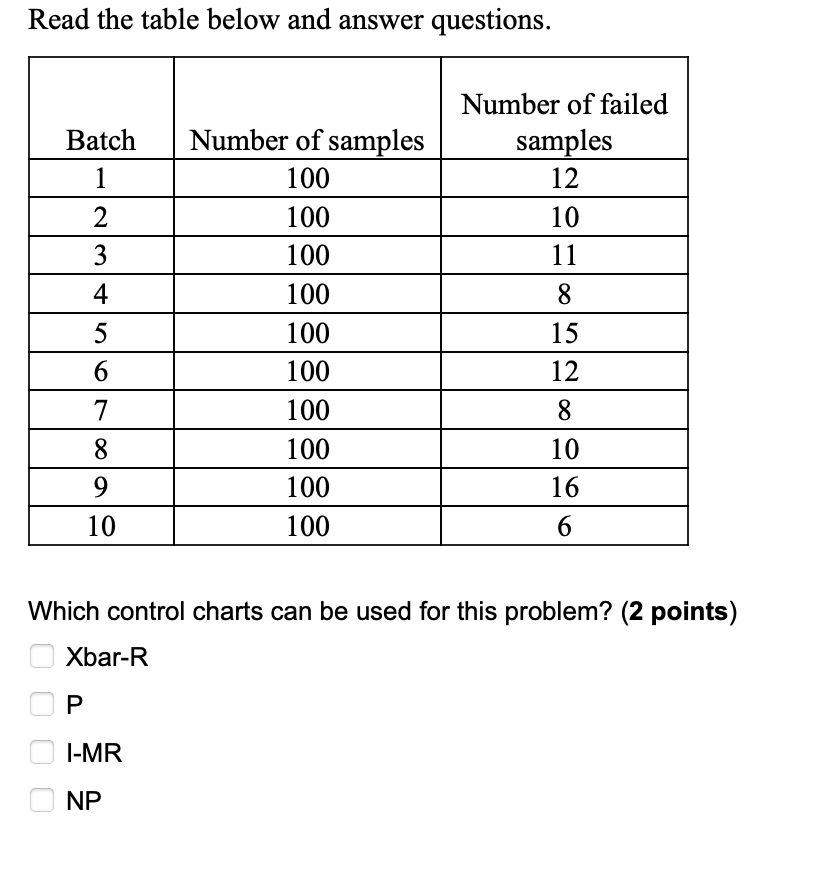
Question: Read the table below and answer questions. Batch 1 2 Number of failed samples 12 10 11 8 3 Number of samples 100 100 100

Read the table below and answer questions. BatchRead the table below and answer questions. BatchRead the table below and answer questions. Batch

Read the table below and answer questions. Batch 1 2 Number of failed samples 12 10 11 8 3 Number of samples 100 100 100 100 100 100 4 mto 5 15 12 6 100 8 7 8 9 10 100 100 100 10 16 6 Which control charts can be used for this problem? (2 points) Xbar-R I-MR OO NP If we decide to use the NP chart for the problem in Question #19, calculate the value of the center line. Round the final result to the second decimal place. (1 point) If we decide to use the NP chart for the problem in Question #19. Calculate the upper control limit (UCL). Round the final result to the second decimal place. (1 point)

Step by Step Solution

There are 3 Steps involved in it

1 Expert Approved Answer
Step: 1 Unlock blur-text-image
Question Has Been Solved by an Expert!

Get step-by-step solutions from verified subject matter experts

Step: 2 Unlock
Step: 3 Unlock

Students Have Also Explored These Related General Management Questions!