

Question: Repeat Exercise 10, using the (S) chart in place of the (R) chart. Data From Exercise 10: A certain type of integrated circuit is connected
Repeat Exercise 10, using the \(S\) chart in place of the \(R\) chart.
Data From Exercise 10:
A certain type of integrated circuit is connected to its frame by five wires. Thirty samples of five units each were taken, and the pull strength (in grams) of one wire on each unit was measured. The data are presented in Table E10 on page 800. The means are \(\overline{\bar{X}}=9.81, \bar{R}=1.14\), and \(\bar{s}=0.4647\).
Table E10:
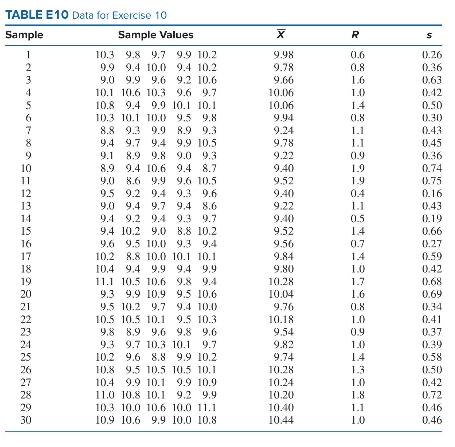
TABLE E10 Data for Exercise 10 Sample 1 2 J455WN. 3 6 8 9 10 11 12 13 14 15 16 17 18 19 20 21 22 23 24 25 26 27 28 29 30 Sample Values 10.3 9.8 9.7 9.9 10.2 9.9 9.4 10.0 9.4 10.2 9.0 9.9 9.6 9.2 10.6 10.1 10.6 10.3 9.6 9.7 10.8 9.4 9.9 10.1 10.1. 10.3 10.1 10.0 9.5 9.8 9.3 9.9 8.9 9.3 8.8 9.4 9.4 9.9 10.5 9.7 9.1 8.9 9.8 9.0 9.3 8.9 9.4 10.6 9.4 8.7 9.0 8.6 9.9 9.6 10.5 9.2 9.4 9.3 9.6 9.5 9.0 9.4 9.7 9.4 8.6 9.4 9.2 9.4 9.3 9.7 9.4 10.2 9.0 8.8 10.2 9.6 9.5 10.0 9.3 9.4 10.2 8.8 10.0 10.1 10.1 10.4 9.4 9.9 9.4 9.9 11.1 10.5 10.6 9.8 9.4 9.3 9.9 10.9 9.5 10.6 9.5 10.2 9.7 9.4 10.0 10.5 10.5 10.1 9.5 10.3 9.8 8.9 9.6 9.8 9.6 9.3 9.7 10.3 10.1 9.7 10.2 9.6 8.8 9.9 10.2 10.8 9.5 10.5 10.5 10.1 10.4 9.9 10.1 9.9 10.9 11.0 10.8 10.1 9.2 9.9 10.3 10.0 10.6 10.0 11.1 10.9 10.6 9.9 10.0 10.8 X 9.98 9.78 9.66 10.06 10.06 9.94 9.24 9.78 9.22 9.40 9.52 9.40 9.22 9.40 9.52 9.56 9.84 9.80 10.28 10.04 9.76 10.18 9.54 9.82 9.74 10.28 10.24 10.20 10.40 10.44 R 0.6 0.8 1.6 1.0 1.4 0.8 1.1 1.1 0.9 1.9 1.9 0.4 1.1 0.5 1.4 0.7 1.4 1.0 1.7 1.6 0.8 1.0 0.9 1.4) 1.4 1.3 1.0 1.8 1.1 1.0 S 0.26 0.36 0.63 0.42 0.50 0.30 0.43 0.45 0.36 0.74 0.75 0.16 0.43 0.19 0.66 0.27 0.59 0.42 0.68 0.69 0.34 0.41 0.37 0.39 0.58 0.50) 0.42 0.72 0.46 0.46
Step by Step Solution
3.32 Rating (152 Votes )
There are 3 Steps involved in it
To use the S chart in place of the R range chart we follow a similar process but focus on the standa... View full answer

Get step-by-step solutions from verified subject matter experts