

Question: Reading above question 10-13 use the chart to answer the multiple choice. question 14-17 question 18-20 Cashflow from Financing Cash flows from financing are cash
Reading above question 10-13 use the chart to answer the multiple choice. 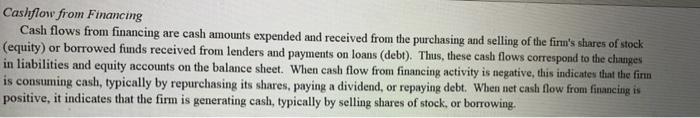
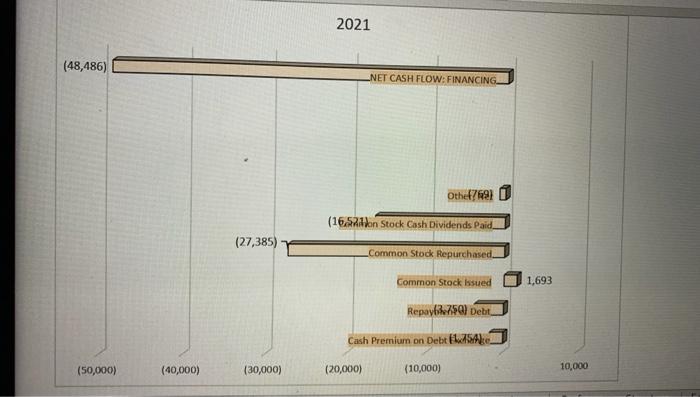
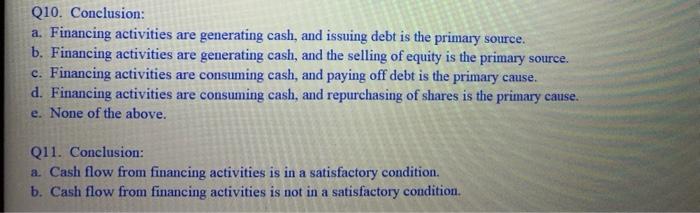
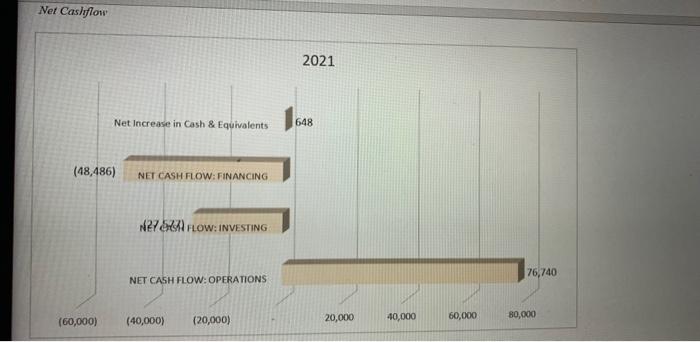
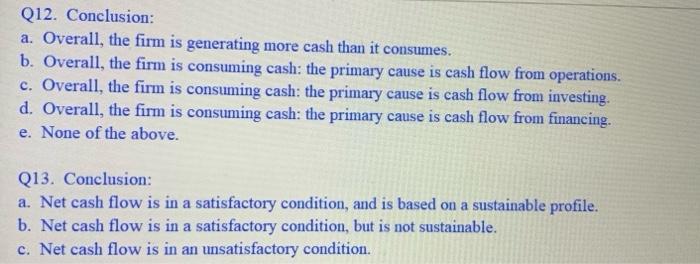
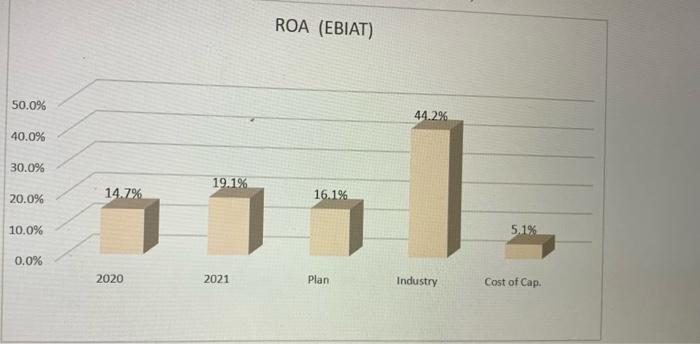
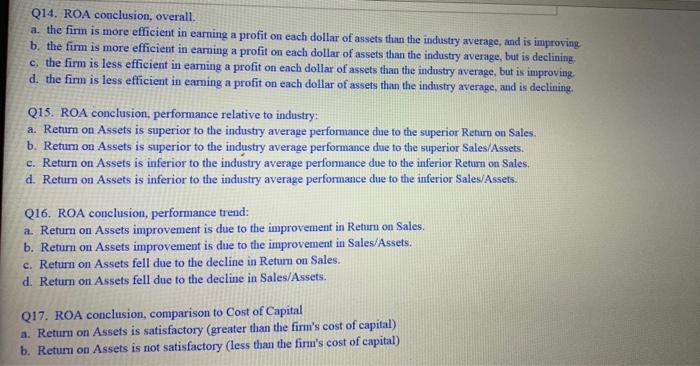
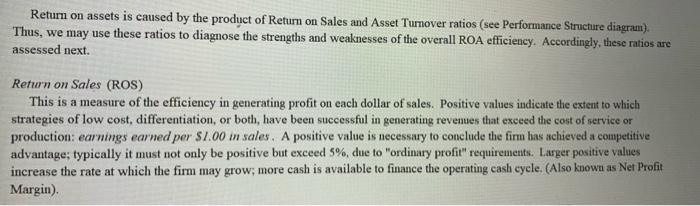
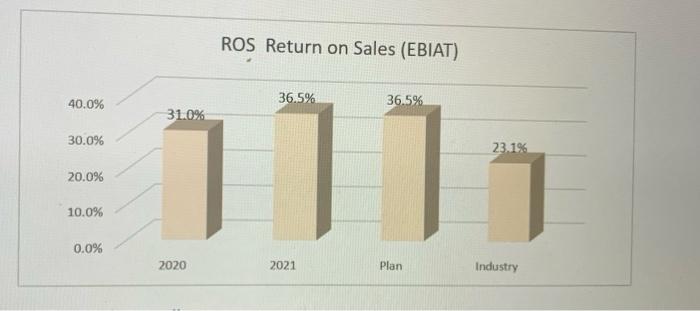
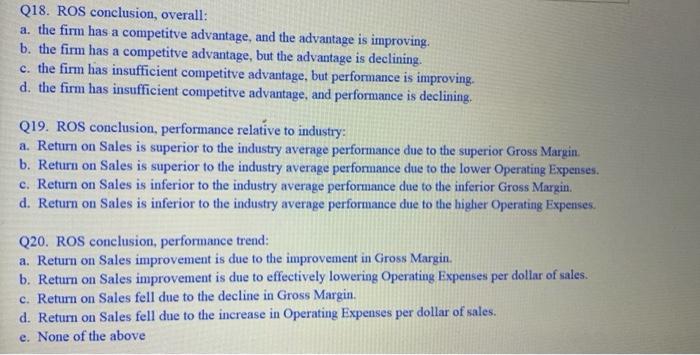
Cashflow from Financing Cash flows from financing are cash amounts expended and received from the purchasing and selling of the firm's shares of stock (equity) or borrowed funds received from lenders and payments on loans (debt). Thus, these cash flows correspond to the changes in liabilities and equity accounts on the balance sheet. When cash flow from financing activity is negative, this indicates that the finn is consuming cash, typically by repurchasing its shares, paying a dividend, or repaying debt. When net cash flow from financing is positive, it indicates that the firm is generating cash, typically by selling shares of stock, or borrowing. 2021 (48,486) NET CASH FLOW: FINANCING Othet769) (16.52don Stock Cash Dividends Paid (27,385) Common Stock Repurchased Common Stock sued 1,693 Repay 759) Debt. Cash Premium on Debtaske (50,000) (40,000) (30,000) (20,000) (10,000) 10,000 Q10. Conclusion: a. Financing activities are generating cash, and issuing debt is the primary source. b. Financing activities are generating cash, and the selling of equity is the primary source. c. Financing activities are consuming cash, and paying off debt is the primary cause. d. Financing activities are consuming cash, and repurchasing of shares is the primary cause. e. None of the above. Q11. Conclusion: a. Cash flow from financing activities is in a satisfactory condition. b. Cash flow from financing activities is not in a satisfactory condition. Net Cashflow 2021 Net Increase in Cash & Equivalents 648 (48,486) NET CASH FLOW: FINANCING N2786 FLOW:INVESTING 76,740 NET CASH FLOW: OPERATIONS 80,000 (60,000) (20,000) 60,000 (40,000) 20,000 40,000 Q12. Conclusion: a. Overall, the firm is generating more cash than it consumes. b. Overall, the firm is consuming cash: the primary cause is cash flow from operations. c. Overall, the firm is consuming cash: the primary cause is cash flow from investing. d. Overall, the firm is consuming cash: the primary cause is cash flow from financing. e. None of the above. Q13. Conclusion: a. Net cash flow is in a satisfactory condition, and is based on a sustainable profile. b. Net cash flow is in a satisfactory condition, but is not sustainable. c. Net cash flow is in an unsatisfactory condition. Operating Efficiency Operating efficiency is the productivity achieved by management in employing the resources of the firm. The primary measures are: return on assets, return on sales, and asset turnover. These ratios will be analyzed according to both their efficiency trend and comparison to industry average efficiency. The first ratio that will be discussed is return on assets. Return on Assets (ROA) This shows the overall efficiency of management in generating earnings given the total amount of assets in the company: earnings per $1.00 in assets. Thus, this is a very broad measure of the operating efficiency of management. Large (positive) values are preferred. (Also known as 'ROA' and often misnamed Return on Investment 'ROMO. ROA (EBIAT) 50.0% 44.2% 40.0% 30.0% .1 19.1% 20.0% 14.7% 16.1% 10.0% 5.1% 0.0% 2020 2021 Plan Industry Cost of Cap. Q14. ROA conclusion, overall a. the firm is more efficient in earning a profit on each dollar of assets than the industry average, and is improving b. the firm is more efficient in earning a profit on each dollar of assets than the industry average, but is declining. c. the firm is less efficient in earning a profit on each dollar of assets than the industry average, but is improving. d. the firm is less efficient in eaming a profit on each dollar of assets than the industry average, and is declining. Q15. ROA conclusion, performance relative to industry: a. Return on Assets is superior to the industry average performance due to the superior Return on Sales b. Return on Assets is superior to the industry average performance due to the superior Sales/Assets. c. Return on Assets is inferior to the industry average performance due to the inferior Return on Sales d. Return on Assets is inferior to the industry average performance due to the inferior Sales/Assets. Q16. ROA conclusion, performance trend: Return on Assets improvement is due to the improvement in Return on Sales. b. Return on Assets improvement is due to the improvement in Sales/Assets. c. Return on Assets fell due to the decline in Return on Sales. d. Return on Assets fell due to the decline in Sales/Assets. Q17. ROA conclusion, comparison to Cost of Capital a. Return on Assets is satisfactory (greater than the firm's cost of capital) b. Return on Assets is not satisfactory (less than the firm's cost of capital) Return on assets is caused by the product of Return on Sales and Asset Turnover ratios (see Performance Structure diagram). Thus, we may use these ratios to diagnose the strengths and weaknesses of the overall ROA efficiency. Accordingly, these ratios are assessed next. Return on Sales (ROS) This is a measure of the efficiency in generating profit on each dollar of sales. Positive values indicate the extent to which strategies of low cost, differentiation, or both, have been successful in generating revemes that exceed the cost of service or production: earnings earned per $1.00 in sales. A positive value is necessary to conclude the firm has achieved a competitive advantage; typically it must not only be positive but exceed 5% due to "ordinary profit" requirements. Larger positive values increase the rate at which the firm may grow, more cash is available to finance the operating cash cycle. (Also known as Net Profit Margin). ROS Return on Sales (EBIAT) 40.0% 36.5% 36.5% 31.0% 30.0% 23.1% 20.0% 10.0% 0.0% 2020 2021 Plan Industry Q18. ROS conclusion, overall: a. the firm has a competitve advantage, and the advantage is improving. b. the firm has a competitve advantage, but the advantage is declining. c. the firm has insufficient competitve advantage, but performance is improving. d. the firm has insufficient competitve advantage, and performance is declining. Q19. ROS conclusion, performance relative to industry: a. Return on Sales is superior to the industry average performance due to the superior Gross Margin. b. Return on Sales is superior to the industry average performance due to the lower Operating Expenses. c. Return on Sales is inferior to the industry average performance due to the inferior Gross Margin. d. Return on Sales is inferior to the industry average performance due to the higher Operating Expenses Q20. ROS conclusion, performance trend: a. Return on Sales improvement is due to the improvement in Gross Margin. b. Return on Sales improvement is due to effectively lowering Operating Expenses per dollar of sales. c. Return on Sales fell due to the decline in Gross Margin. d. Return on Sales fell due to the increase in Operating Expenses per dollar of sales. e. None of the above
question 14-17
question 18-20
Step by Step Solution
There are 3 Steps involved in it
1 Expert Approved Answer
Step: 1 Unlock

Question Has Been Solved by an Expert!
Get step-by-step solutions from verified subject matter experts
Step: 2 Unlock
Step: 3 Unlock