

Question: reading and chart to answer the multiple choice question 21-23 Q26 Q27-28 q29 q30-33 Asset Turnover (AT) This indicates the extent to which management is
reading and chart to answer the multiple choice question 21-23 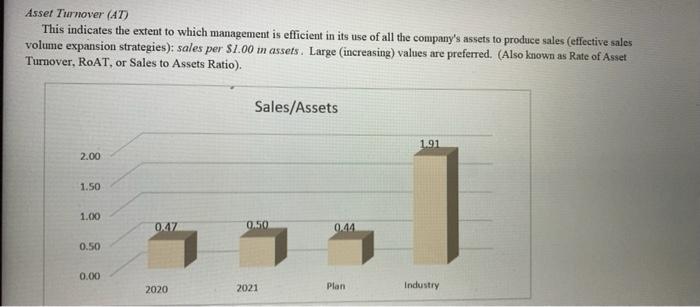
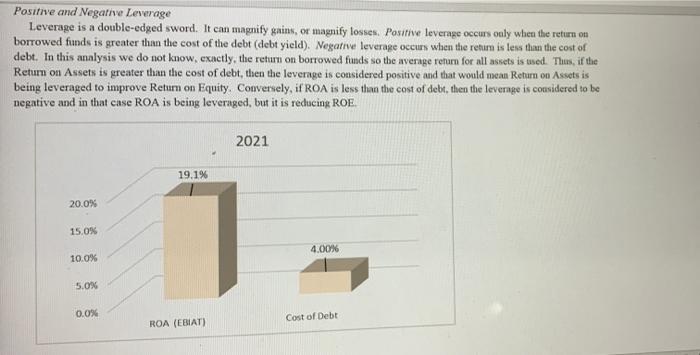
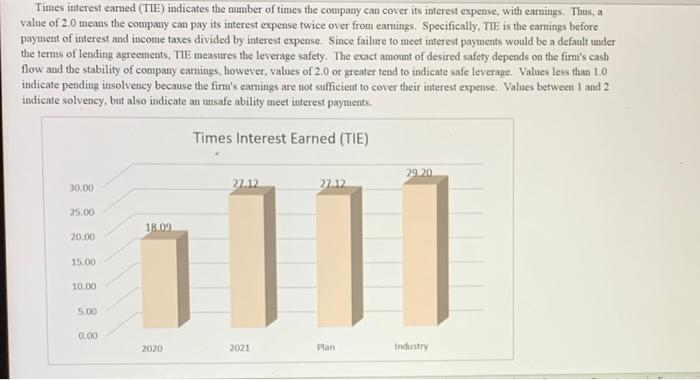
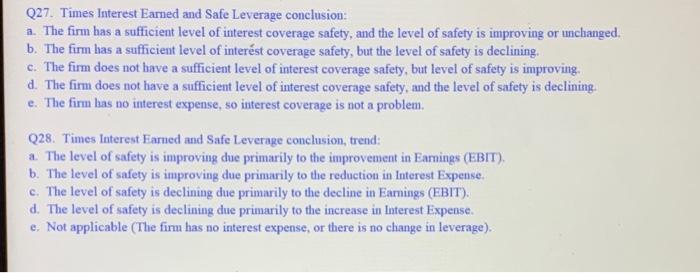
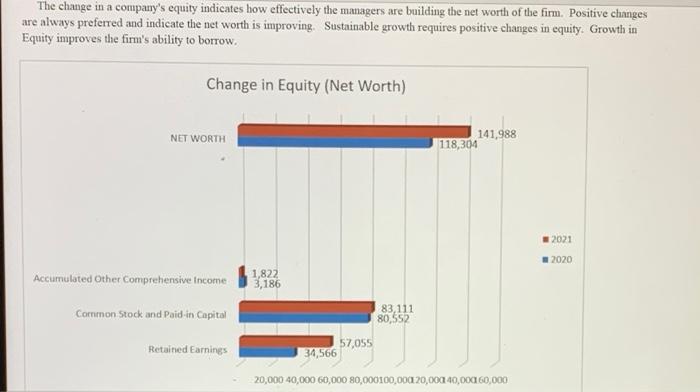
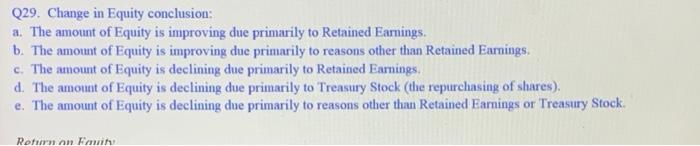
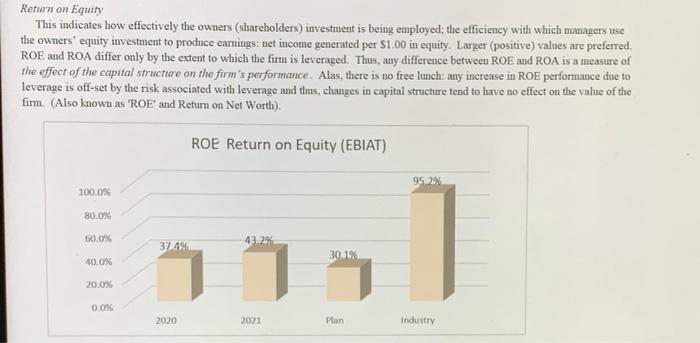
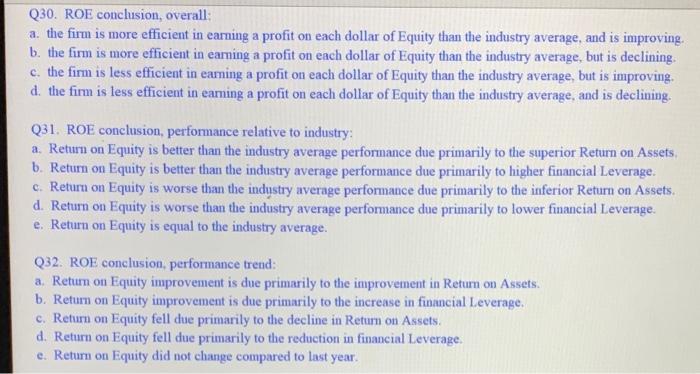
Asset Turnover (AT) This indicates the extent to which management is efficient in its use of all the company's assets to produce sales effective sales volume expansion strategies): sales per $1.00 m assets. Large (increasing) values are preferred. (Also known as Rate of Asset Turnover, RoAT, or Sales to Assets Ratio). Sales/Assets 1.91 2.00 1.50 1 1.00 OXAZ 0450 0.44 0.50 0.00 2020 2021 Plan Industry Q21. Sales/Assets conclusion: a. the firm is relatively efficient in producing sales given their size in assets, and their efficiency is improving. b. the firm is relatively efficient in producing sales given their size in assets, but their efficiency is deteriorating. c. the firm is not relatively efficient in producing sales given their size in assets, but their efficiency is improving d. the firm is not relatively efficient in producing sales given their size in assets, and their efficiency is deteriorating Q22. Sales/Assets conclusion, performarice trend: a. Sales/Assets improvement is due to Sales growing at a faster rate than Assets. b. Sales/Assets improvement is due to Sales falling at a slower rate than Assets. c. Sales/Assets fell due to Assets growing at a faster rate than Sales. d. Sales/Assets fell due to Assets beng divested at a slower rate than the decline in Sales. Q23. Operating Efficiency conclusion: a. Overall, the trend in ROA, ROS and Sales/Assets all indicate excellent management b. Overall, the most significant problem is the trend in ROS; due to the trend in earnings c. Overall, the most significant problem is the trend in ROS; due to the trend in sales. d. Overall, the most significant problem is the trend in Sales/Assets; due to the trend in sales. e. Overall, the most significant problem is the trend in Sales/Assets; due to the trend in assets. Positive and Negative Leverage Leverage is a double-edged sword. It can magnify gains, or magnify losses. Positive leverage occurs only when the return on borrowed funds is greater than the cost of the debt (debt yield). Negative leverage occurs when the return is less than the cost of debt. In this analysis we do not know exactly, the return on borrowed funds so the average return for all assets is used. Thus, if the Return on Assets is greater than the cost of debt, then the leverage is considered positive and that would mean Return on Assets is being leveraged to improve Return on Equity. Conversely, if ROA is less than the cost of debit, then the leverage is considered to be negative and in that case ROA is being leveraged, but it is recticing ROE 2021 19.1% 20.0% 15.0% 4.00% 10.0% 5.0% 0.0% Cost of Debt ROA (EBIT) Q26. Positive and Negative Leverage conclusion: a. The firm is positvely leveraged; increasing leverage will increase ROE. b. The firm is negatively leveraged; increasing leverage will decrease ROE. The primary problem is low ROA c. The firm is negatively leveraged; increasing leverage will decrease ROE. The primary problem is the high cost of Debt d. Not applicable (the firm is not leveraged) Times interest earned (TIE) indicates the number of times the company can cover its interest expense, with earnings. Thus, a value of 2.0 means the company can pay its interest expense twice over from earnings. Specifically, TIE is the earnings before payment of interest and income taxes divided by interest expense. Since failure to meet interest payments would be a default under the terms of lending agreements, TIE measures the leverage safety. The exact amount of desired safety depends on the firm's cash flow and the stability of company earnings, however, values of 2.0 or greater tend to indicate safe leverage Values less than 1.0 indicate pending insolvency because the firm's earnings are not sufficient to cover their interest expense. Values between 1 and 2 indicate solvency, but also indicate an unsafe ability meet interest payments. Times Interest Earned (TIE) 29.20 30.00 27.12 27.12 25.00 18.09 20.00 111) 15.00 10.00 5.00 0.00 2020 2021 Plan Industry Q27. Times Interest Earned and Safe Leverage conclusion: a. The firm has a sufficient level of interest coverage safety, and the level of safety is improving or unchanged. b. The firm has a sufficient level of interst coverage safety, but the level of safety is declining. c. The firm does not have a sufficient level of interest coverage safety, but level of safety is improving. d. The firm does not have a sufficient level of interest coverage safety, and the level of safety is declining. e. The firm has no interest expense, so interest coverage is not a problem. Q28. Times Interest Famed and Safe Leverage conclusion, trend: a. The level of safety is improving clue primarily to the improvement in Earnings (EBIT), b. The level of safety is improving due primarily to the reduction in Interest Expense. c. The level of safety is declining due primarily to the decline in Earnings (EBIT) d. The level of safety is declining due primarily to the increase in Interest Expense. e. Not applicable (The firm has no interest expense, or there is no change in leverage). The change in a company's equity indicates how effectively the managers are building the net worth of the firm. Positive changes are always preferred and indicate the net worth is improving. Sustainable growth requires positive changes in equity. Growth in Equity improves the firm's ability to borrow. Change in Equity (Net Worth) NET WORTH 141,988 118,304 2021 - 2020 Accumulated Other Comprehensive income 1,822 3,186 Common Stock and Poidin Capital 83,111 80,552 Retained Earnings 57,055 34,566 20,000 40,000 60,000 80,000100,000 20,000 40,000 60,000 Q29. Change in Equity conclusion: a. The amount of Equity is improving due primarily to Retained Earnings. b. The amount of Equity is improving due primarily to reasons other than Retained Earnings. c. The amount of Equity is declining due primarily to Retained Earnings d. The amount of Equity is declining due primarily to Treasury Stock (the repurchasing of shares) e. The amount of Equity is declining due primarily to reasons other than Retained Earnings or Treasury Stock Return on timin Return on Equity This indicates how effectively the owners (shareholders) investment is being employed the efficiency with which managers use the owners' equity investment to produce earnings: net income generated per $1.00 in equity. Larger (positive) values are preferred. ROE and ROA differ only by the extent to which the firm is leveraged. Thus, any difference between ROE and ROA is a measure of the effect of the capital structure on the firm's performance. Alas, there is no free lunch: any increase in ROE performance due to leverage is off-set by the risk associated with leverage and thus, changes in capital structure tend to have no effect on the value of the firm. (Also known as 'ROE' and Return on Net Worth). ROE Return on Equity (EBIAT) 95.2% 100.0% 80.0% 60.0% 37496 1. 43.29% 30.19 40.0% 20.0% 0.0% 2020 2021 Plan Industry Q30. ROE conclusion, overall: a. the firm is more efficient in earning a profit on each dollar of Equity than the industry average, and is improving. b. the firm is more efficient in earning a profit on each dollar of Equity than the industry average, but is declining. c. the firm is less efficient in earning a profit on each dollar of Equity than the industry average, but is improving. d. the firm is less efficient in eaming a profit on each dollar of Equity than the industry average, and is declining. Q31. ROE conclusion, performance relative to industry: a. Return on Equity is better than the industry average performance due primarily to the superior Return on Assets b. Return on Equity is better than the industry average performance due primarily to higher financial Leverage. c. Return on Equity is worse than the industry average performance due primarily to the inferior Return on Assets d. Return on Equity is worse than the industry average performance due primarily to lower financial Leverage. e. Return on Equity is equal to the industry average. Q32. ROE conclusion, performance trend: a. Return on Equity improvement is due primarily to the improvement in Return on Assets. b. Return on Equity improvement is due primarily to the increase in financial Leverage. c. Return on Equity fell due primarily to the decline in Return on Assets d. Return on Equity fell due primarily to the reduction in financial Leverage. e. Return on Equity did not change compared to last year. Overall assessment of Capital Structure Q33. Capital Structure conclusion: a. The capital structure is fine; it is not hurting the performance of the firm b. The financial Leverage is not at a safe level, the capital structure is hurting the performance of the firm, c. The financial Leverage is not at a safe level, but there are positive indicators of firm performance that suggest the capital structure is fine c Q26
Q27-28
q29
q30-33
Step by Step Solution
There are 3 Steps involved in it
1 Expert Approved Answer
Step: 1 Unlock

Question Has Been Solved by an Expert!
Get step-by-step solutions from verified subject matter experts
Step: 2 Unlock
Step: 3 Unlock