

Question: Really Need help with these 2 problems please, thank you! Exercise 1: - C46 is the objective function with the grey shade - Row 51
Really Need help with these 2 problems please, thank you!
Exercise 1: - C46 is the objective function with the grey shade
- Row 51 is the constraints
- Row 59-63 is for Excess Capacity under Plant Capacities
- Then solver, find optimal supply allocation plan
Exercise 2: Decision Tree
Thanks!
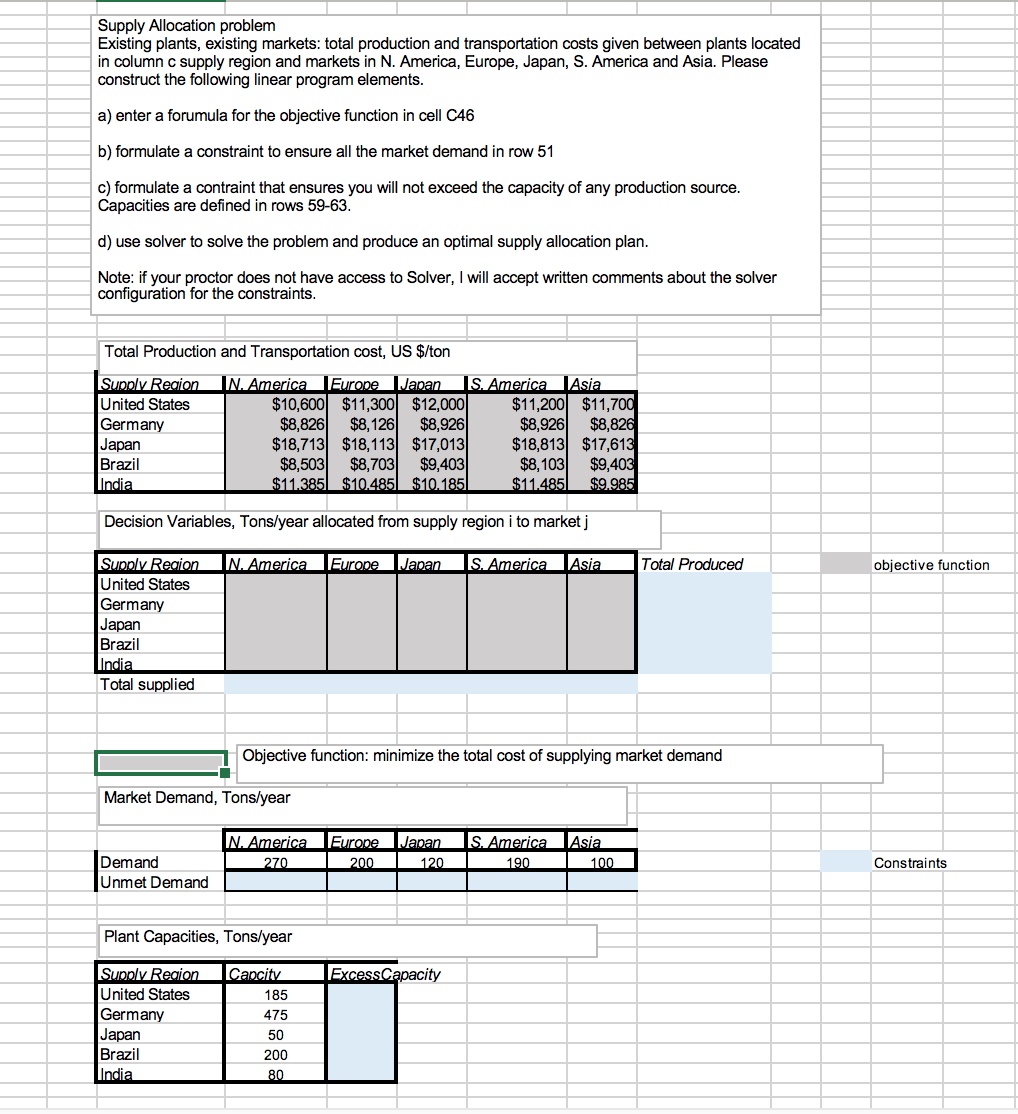
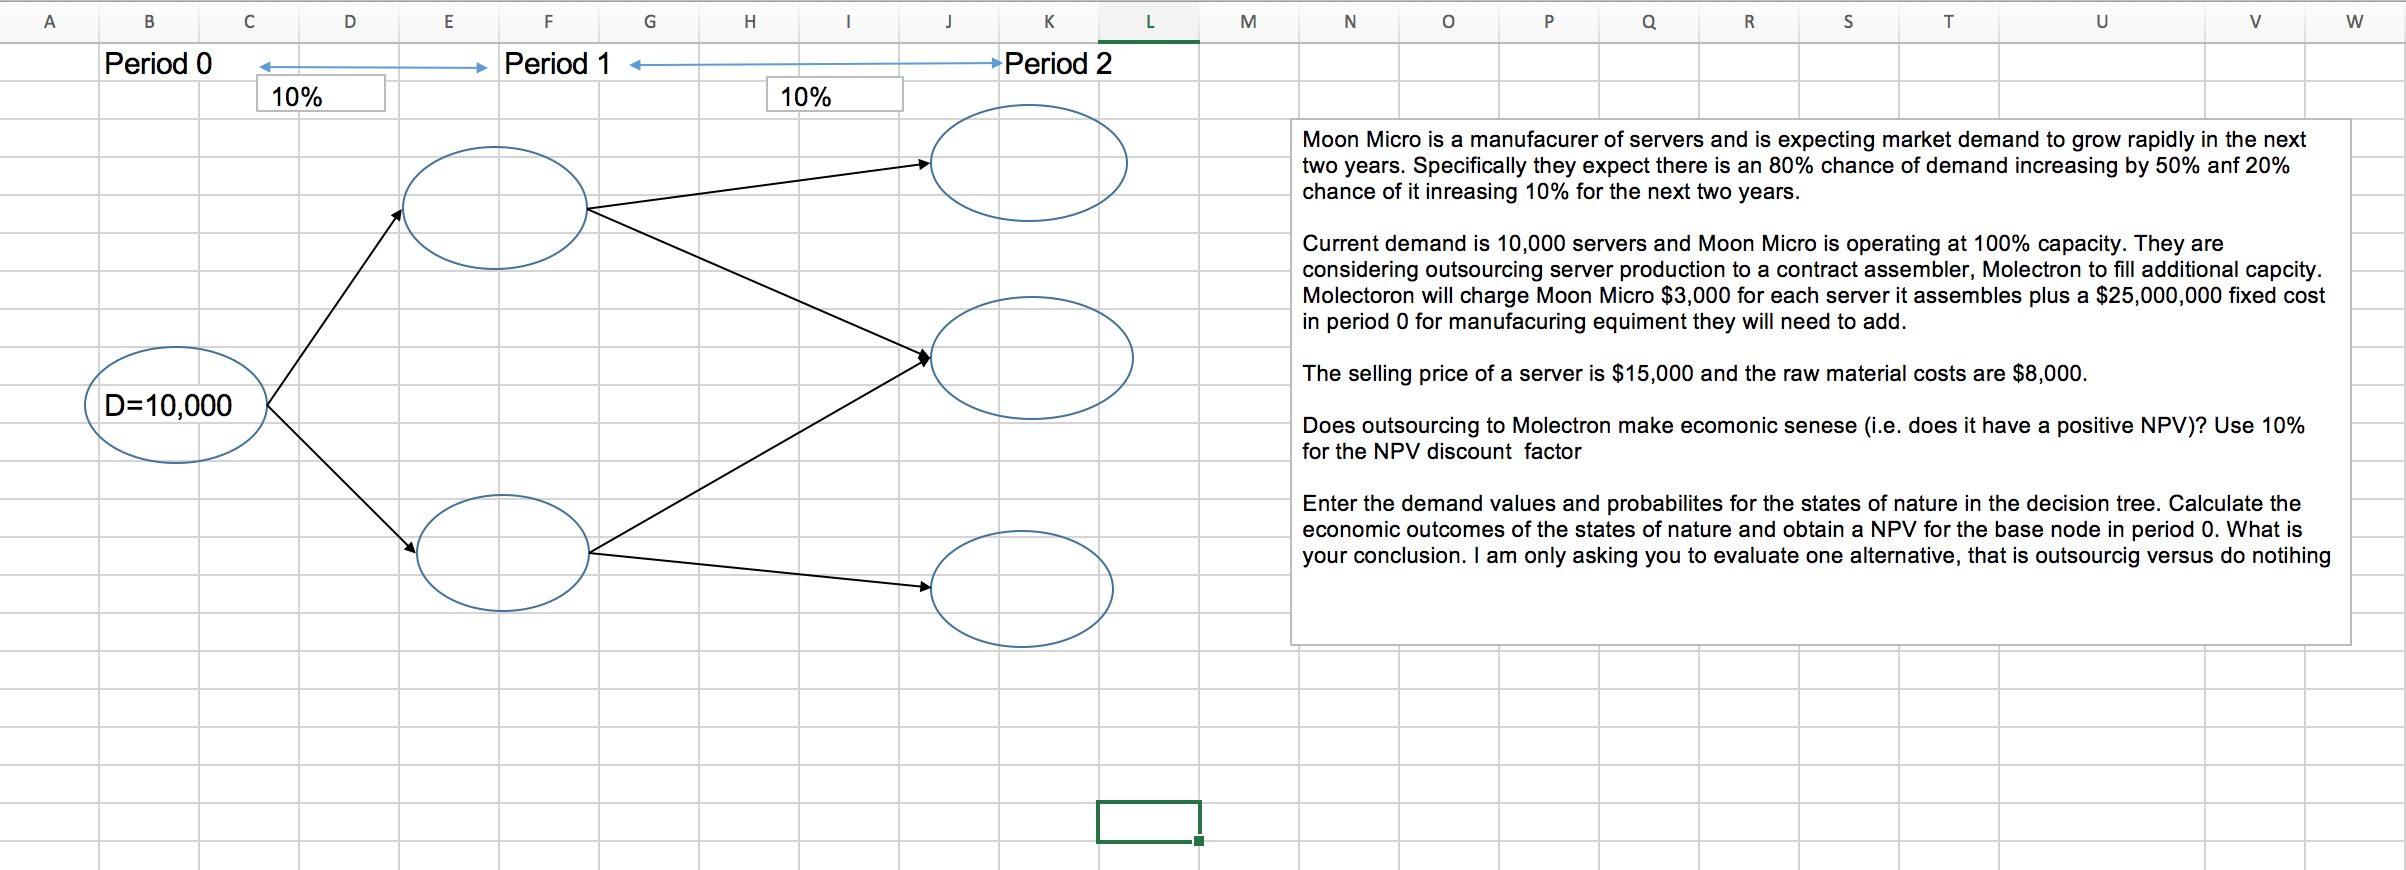
Supply Allocation problem Existing plants, existing markets: total production and transportation costs given between plants located in column c supply region and markets in N. America, Europe, Japan, S. America and Asia. Please construct the following linear program elements. a) enter a forumula for the objective function in cell 046 b) formulate a constraint to ensure all the market demand in row 51 c) formulate a contraint that ensures you will not exceed the capacity of any production source. Capacities are defined in rows 59-63. d) use solver to solve the problem and produce an optimal supply allocation plan. Note: if your proctor does not have access to Solver, I will accept written comments about the solver configuration for the constraints. Asia Total Production and Transportation cost, US $/ton Supply Region IN. America Europe Japan S. America United States $10,600 $11,300 $12,000 $11,200 $11,700 Germany $8,826 $8,126 $8,926 $8,926 $8,826 Japan $18,713 $18,113 $17,013 $18,813 $17,613 Brazil $8,503 $8,703 $9,403) $8,103 $9,403 India $11.385 $10.485 $10.185 $11.485 $9.985 Decision Variables, Tons/year allocated from supply region i to market i IN. America Europe Japan S. America Asia Total Produced objective function Supply Region United States Germany Japan Brazil India Total supplied Objective function: minimize the total cost of supplying market demand Market Demand, Tons/year N. America 270 Europe 200 Japan 120 S. America 190 Demand Unmet Demand Asia 100 Constraints Plant Capacities, Tons/year Excess Capacity Supply Region United States Germany Japan Brazil India Capcity 185 475 50 200 80 A B D E F. G H 1 j L 3 N o Q R s T U V 13 Period 0 Period 1 Period 2 10% 10% Moon Micro is a manufacurer of servers and is expecting market demand to grow rapidly in the next two years. Specifically they expect there is an 80% chance of demand increasing by 50% anf 20% chance of it inreasing 10% for the next two years. Current demand is 10,000 servers and Moon Micro is operating at 100% capacity. They are considering outsourcing server production to a contract assembler, Molectron to fill additional capcity. Molectoron will charge Moon Micro $3,000 for each server it assembles plus a $25,000,000 fixed cost in period 0 for manufacuring equiment they will need to add. The selling price of a server is $15,000 and the raw material costs are $8,000. D=10,000 Does outsourcing to Molectron make ecomonic senese (i.e. does it have a positive NPV)? Use 10% for the NPV discount factor Enter the demand values and probabilites for the states of nature in the decision tree. Calculate the economic outcomes of the states of nature and obtain a NPV for the base node in period 0. What is your conclusion. I am only asking you to evaluate one alternative, that is outsourcig versus do notihingStep by Step Solution
There are 3 Steps involved in it
1 Expert Approved Answer
Step: 1 Unlock

Question Has Been Solved by an Expert!
Get step-by-step solutions from verified subject matter experts
Step: 2 Unlock
Step: 3 Unlock