

Question: Real-Time Data Analysis Exercise The following table and graph contain the most recent money supply data (December 2023) from FRED*. The data are components
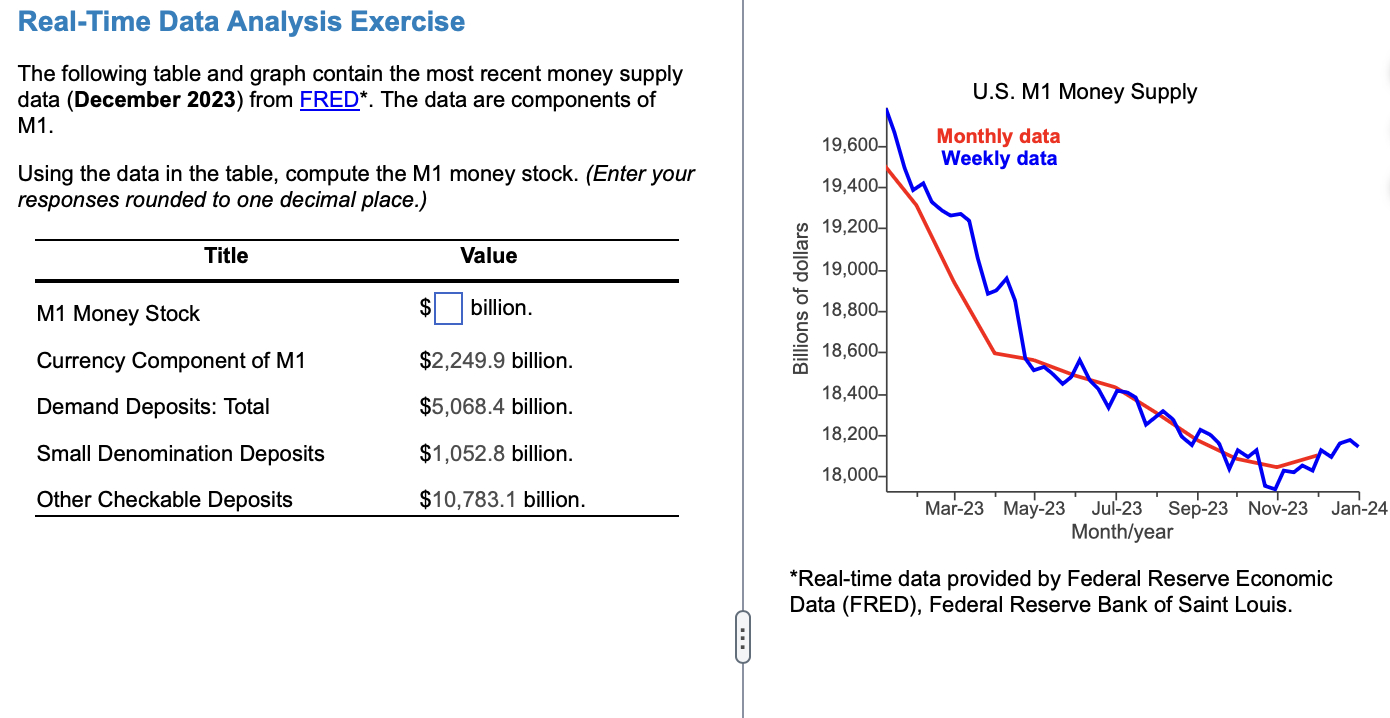
Real-Time Data Analysis Exercise The following table and graph contain the most recent money supply data (December 2023) from FRED*. The data are components of M1. U.S. M1 Money Supply 19,600- Monthly data Weekly data 19,400- 19,200- 19,000- Using the data in the table, compute the M1 money stock. (Enter your responses rounded to one decimal place.) Title Value M1 Money Stock $ billion. Currency Component of M1 $2,249.9 billion. Billions of dollars 18,800- 18,600- 18,400- Demand Deposits: Total $5,068.4 billion. 18,200- Small Denomination Deposits $1,052.8 billion. 18,000- Other Checkable Deposits $10,783.1 billion. Mar-23 May-23 Jul-23 Sep-23 Nov-23 Jan-24 Month/year *Real-time data provided by Federal Reserve Economic Data (FRED), Federal Reserve Bank of Saint Louis.
Step by Step Solution
There are 3 Steps involved in it

Get step-by-step solutions from verified subject matter experts