

Question: Recently when I tried to visualize similarities between different groups in a social network, I discovered an interesting phenomenon that I couldn't explain. Can someone
Recently when I tried to visualize similarities between different groups in a social network, I discovered an interesting phenomenon that I couldn't explain. Can someone give me some insight on this? The story is as follows: Users can create different groups on our social network website, and we'd like to visualize the similarities between different groups in 2D. We use the group members and their page views within the group as the feature vector of each group, and the similarity between groups is computed as the cosine similarity between their feature vectors. I used multidimensional scaling ( cm-scale in R ) to reduce the data into 2D and visualized the data. The result of the MDS is points lined up with some lines orthogonal to each other. Can someone explain why this is happening?
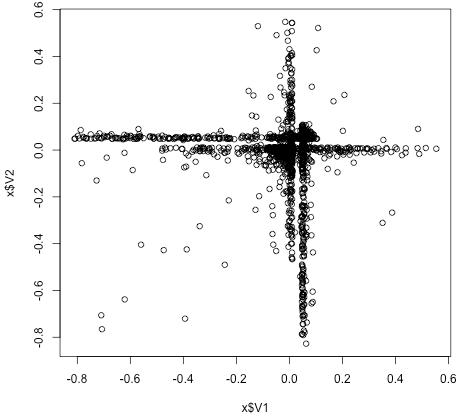
-0.8 -0.6 -0.4 -0.2 0.0 0.2 0.4 0.6 x$V1 x$V2 -0.4 -0.2 0.2 0.4 0.6 -0.8 0'0 9'0- 00 O 00
Step by Step Solution
3.47 Rating (147 Votes )
There are 3 Steps involved in it
The phenomenon youre observing with the points aligning along axes in your multidimensional scaling MDS plot can occur due to several reasons associat... View full answer

Get step-by-step solutions from verified subject matter experts