

Question: RecorORU In addition this assignment will get students thinking about how to handle data that is missing, muddy, unclear, etc. You are expected to
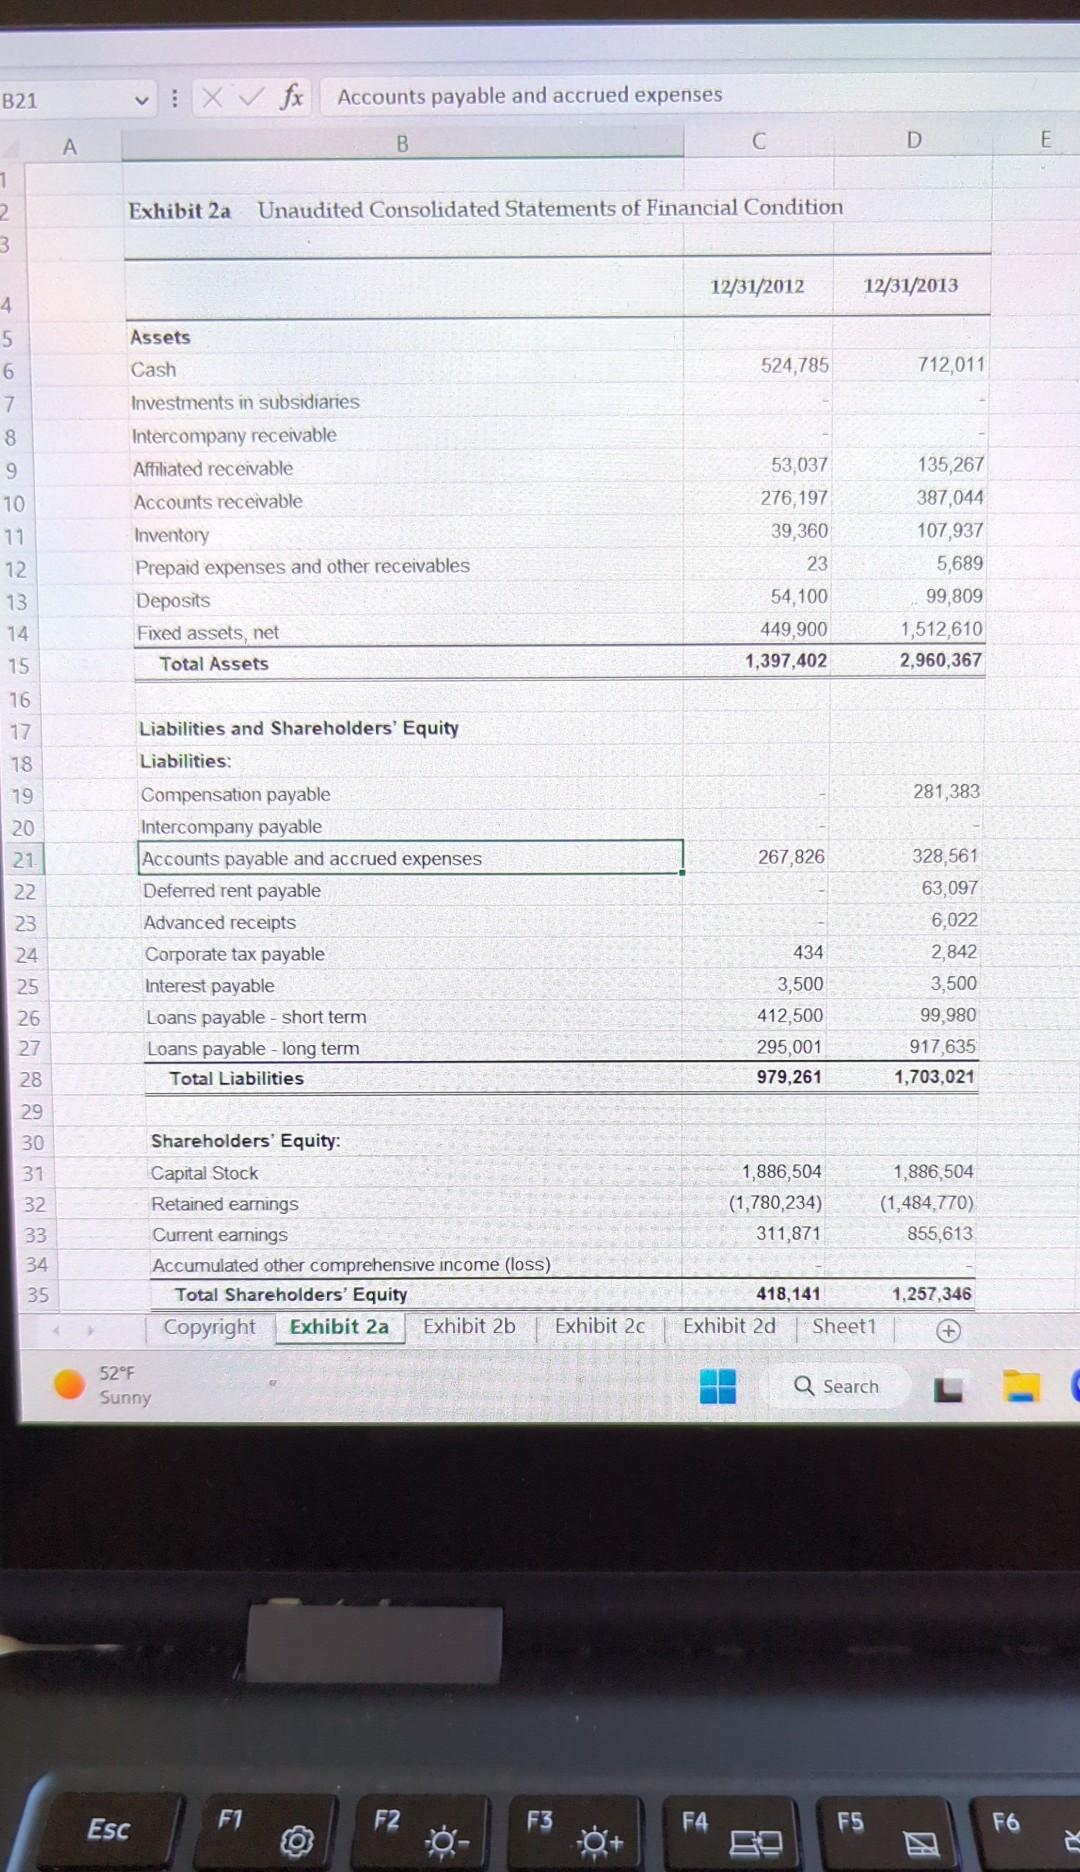
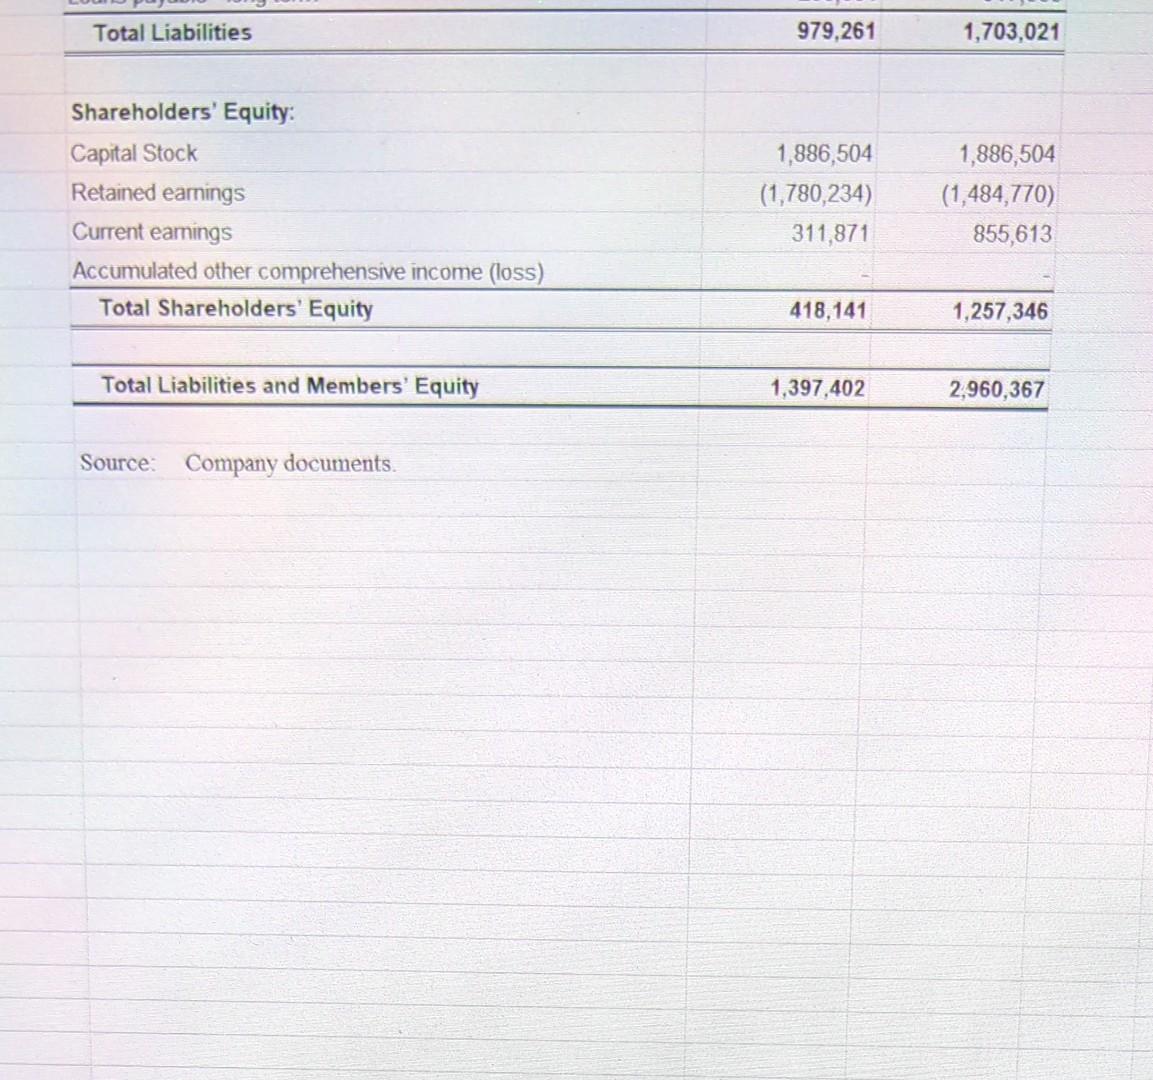
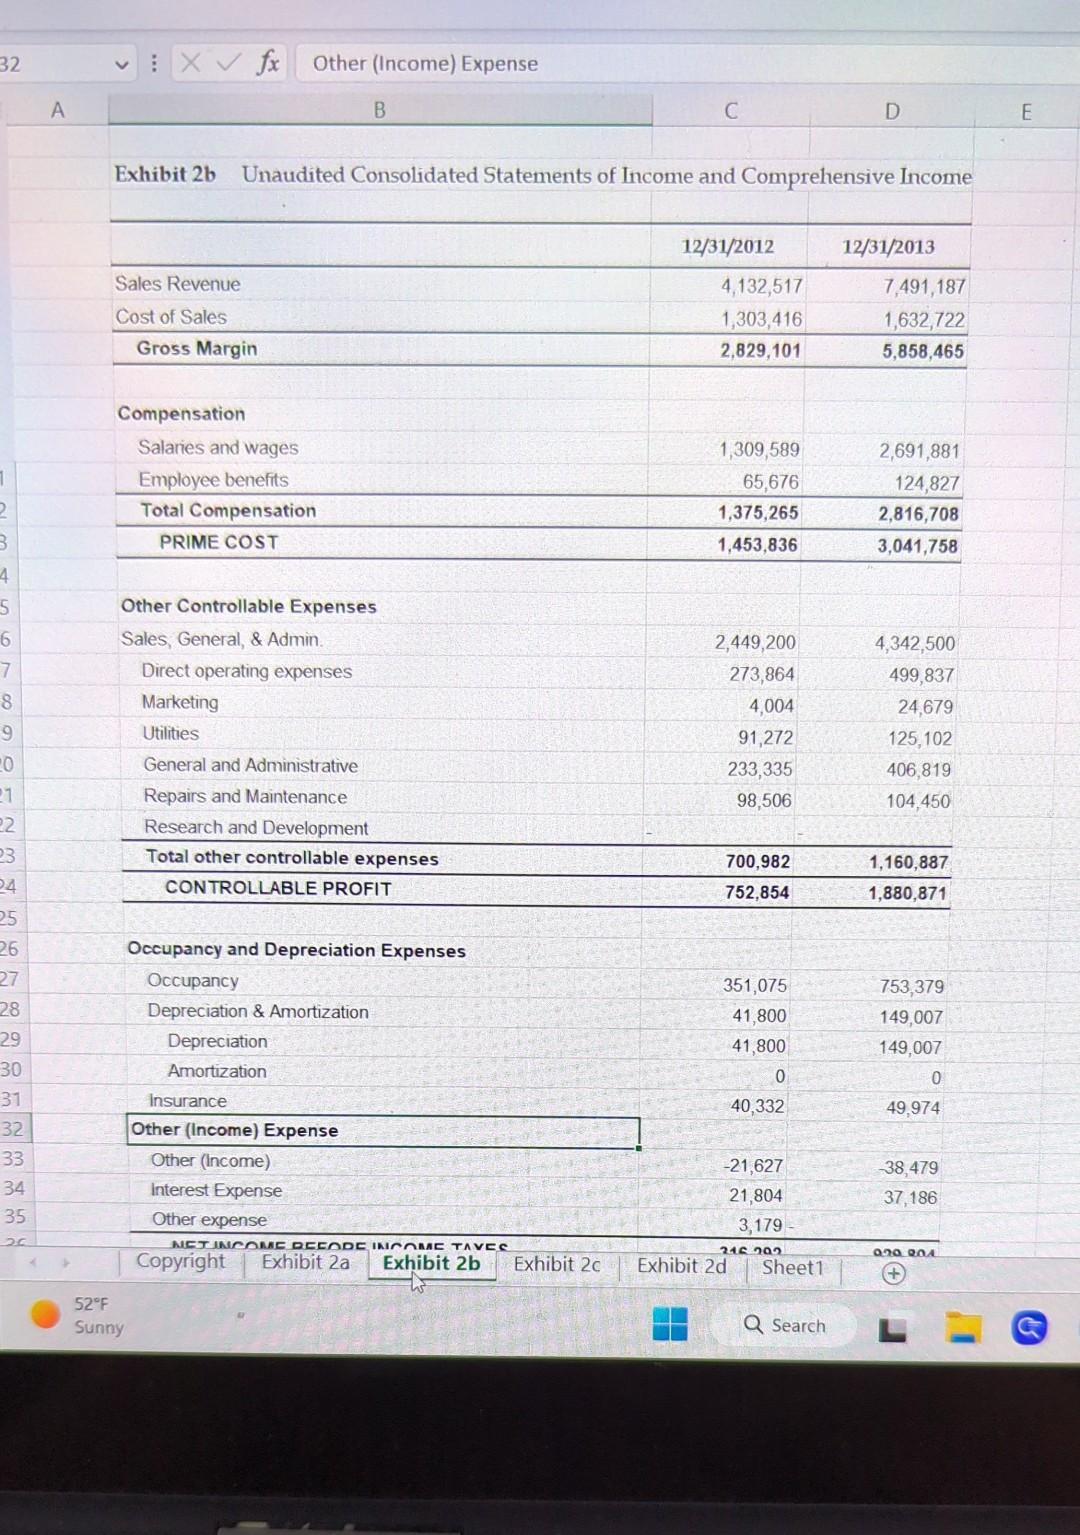
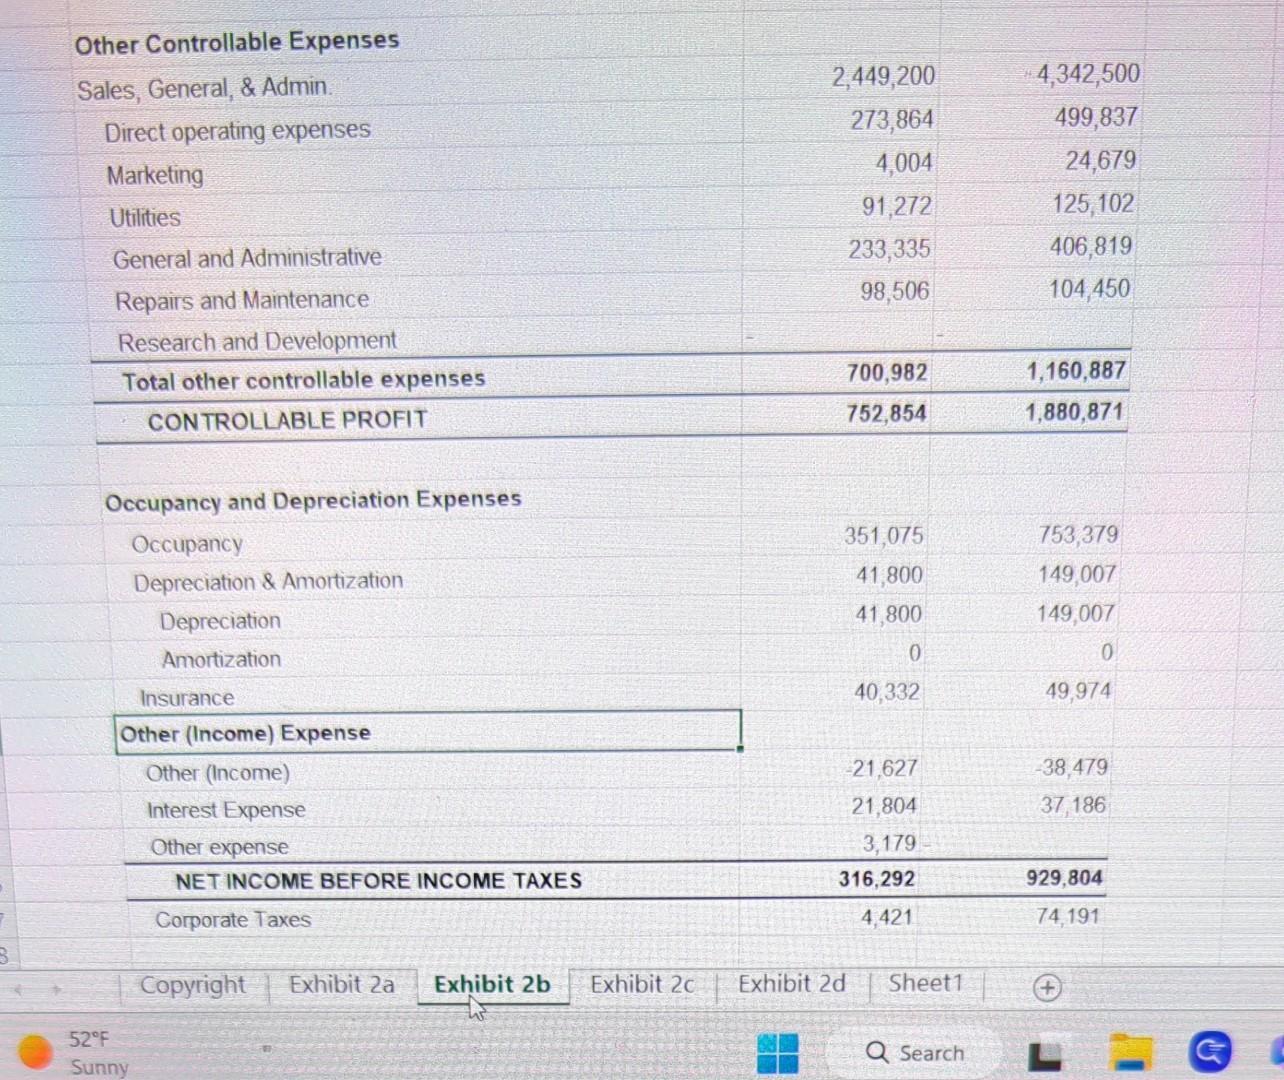
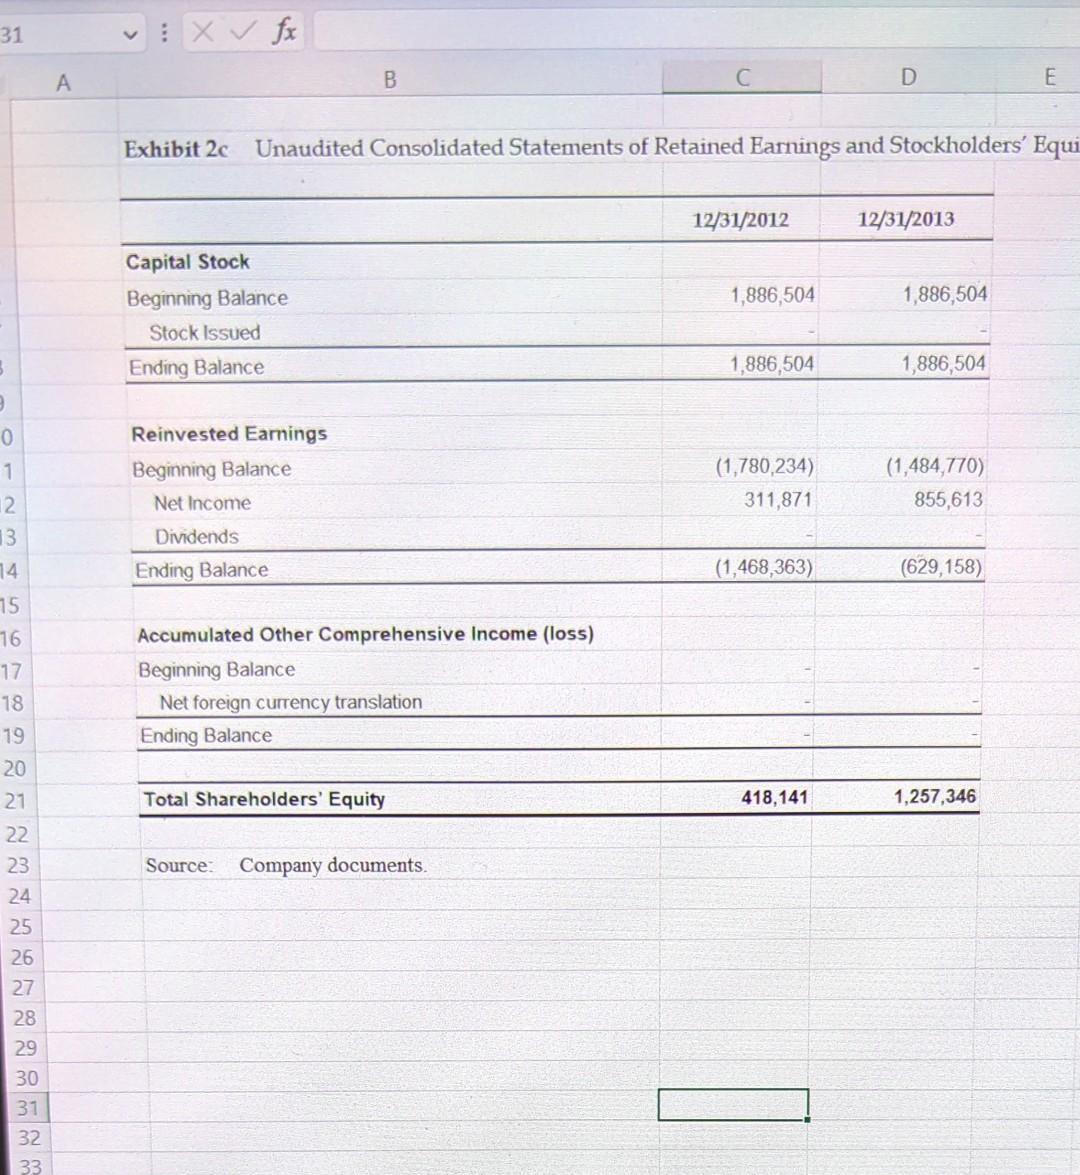
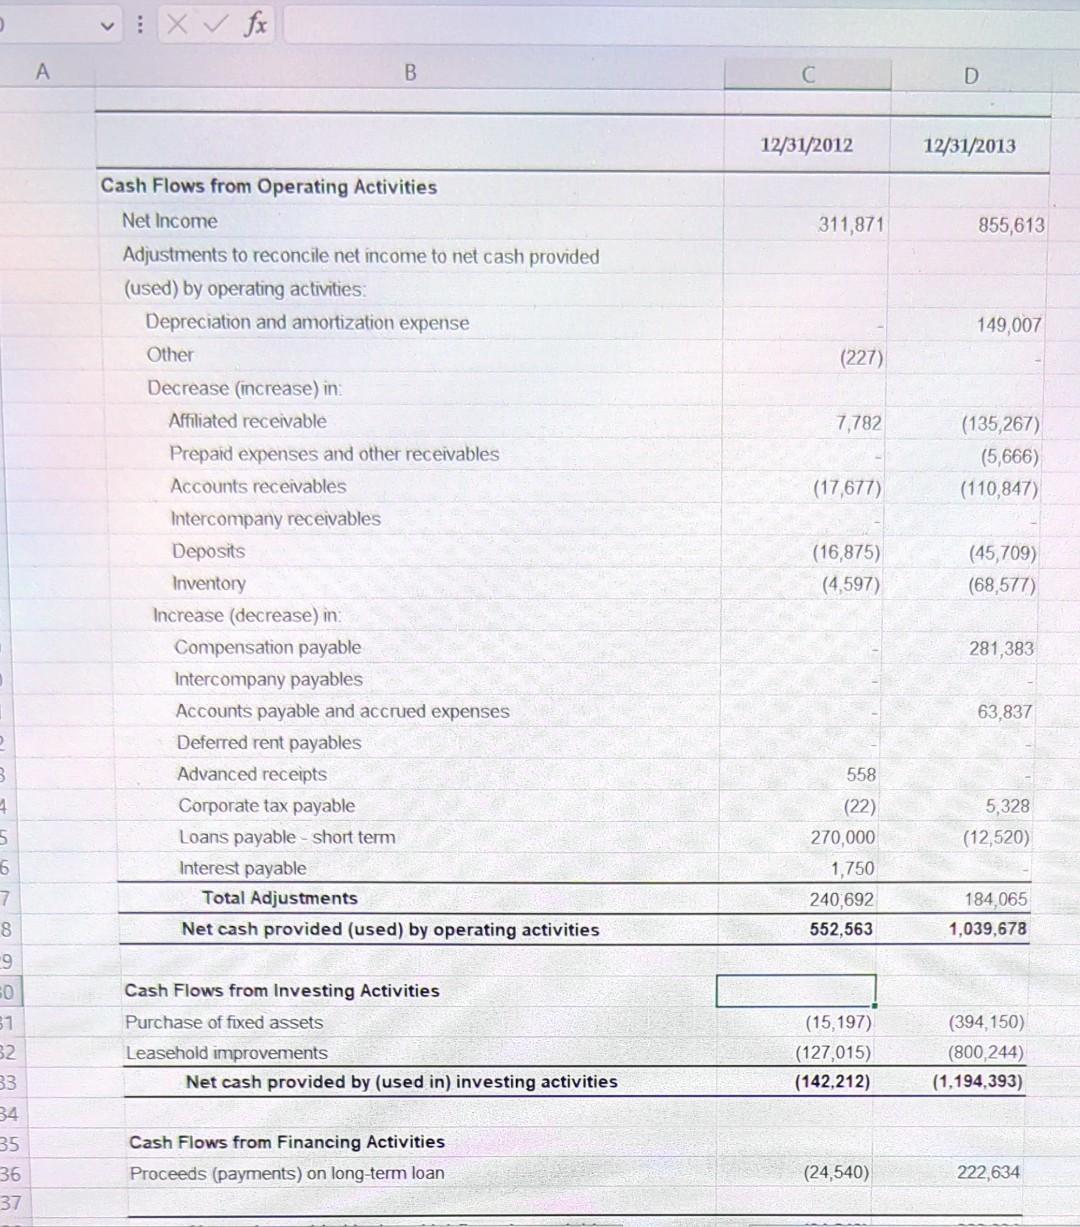
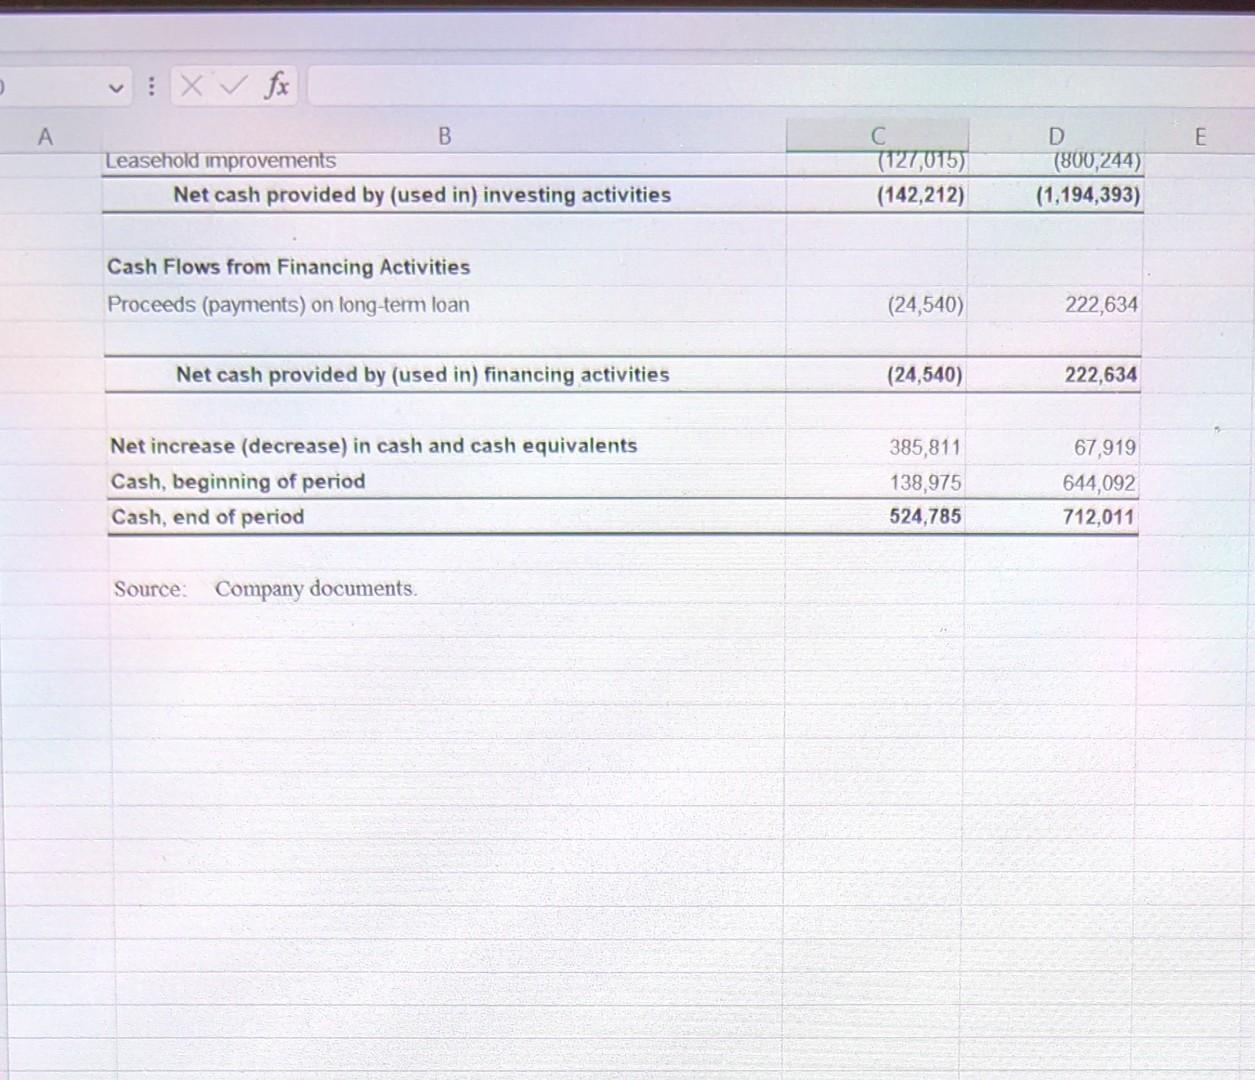
RecorORU In addition this assignment will get students thinking about how to handle data that is missing, muddy, unclear, etc. You are expected to critically evaluate data and make decisions based only on the information that has been given to you. This assignment will give students basic Excel skills that are needed for industry. TASK Note: the "unaudited consolidated statements of financial condition" will be perceived as balance sheet. 1. Prepare the comparative income statement. (Excel) 2. Prepare the comparative balance sheets. (Excel) 3. Prepare a common-size income statement. (Excel) 4. Prepare a common-size balance sheet. (Excel) 5. What was the net book value of fixed assets at the end of 2013? 6. What was the working capital at the end of 2013? 7. What was the net income for 2013? 8. What is the definition of Prime Cost? What was the prime cost for 2013? Bonus question: Was there any noticeable problem on the Statements of Cash Flows that does not follow basic accounting practices? CRITERIA You need to answer all tasks to get points for this assignement. Any missing portion would grand B21 1 2 3 4 5 6 7 8 9 10 11 12 13 14 15 16 17 18 19 20 21 22 23 24 25 26 27 28 29 30 31 32 33 34 35 A V Assets Cash Esc X fx Exhibit 2a Unaudited Consolidated Statements of Financial Condition Investments in subsidiaries Intercompany receivable Accounts payable and accrued expenses B Affiliated receivable Accounts receivable Inventory Prepaid expenses and other receivables Deposits Fixed assets, net Total Assets Liabilities and Shareholders' Equity Liabilities: Compensation payable Intercompany payable Accounts payable and accrued expenses Deferred rent payable Advanced receipts 52F Sunny Corporate tax payable Interest payable Loans payable - short term Loans payable - long term Total Liabilities Shareholders' Equity: Capital Stock Retained earnings Current earnings F1 F2 C F3 F4 12/31/2012 524,785 53,037 276,197 39,360 23 Accumulated other comprehensive income (loss) Total Shareholders' Equity 418,141 Copyright Exhibit 2a Exhibit 2b Exhibit 2c Exhibit 2d 54,100 449,900 1,397,402 267,826 434 3,500 412,500 295,001 979,261 1,886,504 (1,780,234) 311,871 12/31/2013 Sheet1 D Q Search F5 712,011 135,267 387,044 107,937 5,689 99,809 1,512,610 2,960,367 281,383 328,561 63,097 6,022 2,842 3,500 99,980 917,635 1,703,021 1,886,504 (1,484,770) 855,613 1,257,346 F6 E XS Total Liabilities Shareholders' Equity: Capital Stock Retained earnings Current earnings Accumulated other comprehensive income (loss) Total Shareholders' Equity Total Liabilities and Members' Equity Source: Company documents. 979,261 1,886,504 (1,780,234) 311,871 418,141 1,397,402 1,703,021 1,886,504 (1,484,770) 855,613 1,257,346 2,960,367 32 2 B 4 5 6 7 8 9 20 21 22 23 94 25 26 27 28 29 30 31 32 33 34 35 A V X fx Sales Revenue Cost of Sales Gross Margin Compensation 52F Sunny Exhibit 2b Unaudited Consolidated Statements of Income and Comprehensive Income Other (Income) Expense Salaries and wages Employee benefits Total Compensation PRIME COST Other Controllable Expenses Sales, General, & Admin. Direct operating expenses Marketing Utilities General and Administrative Repairs and Maintenance Research and Development Total other controllable expenses CONTROLLABLE PROFIT B Depreciation Amortization Occupancy and Depreciation Expenses Occupancy Depreciation & Amortization Insurance C Other (Income) Expense Other (Income) Interest Expense Other expense NET INCOME RECODE INCOME TAVES Copyright Exhibit 2a Exhibit 2b Exhibit 2c 12/31/2012 4,132,517 1,303,416 2,829,101 1,309,589 65,676 1,375,265 1,453,836 2,449,200 273,864 4,004 91,272 233,335 98,506 700,982 752,854 351,075 41,800 41,800 0 40,332 -21,627 21,804 Exhibit 2d 3,179 - 216.202 Sheet1 D Q Search 12/31/2013 7,491,187 1,632,722 5,858,465 2,691,881 124,827 2,816,708 3,041,758 4,342,500 499,837 24,679 125,102 406,819 104,450 1,160,887 1,880,871 753,379 149,007 149,007 0 49,974 38,479 37,186 020 201 1 E 8 Other Controllable Expenses Sales, General, & Admin. Direct operating expenses Marketing Utilities General and Administrative Repairs and Maintenance Research and Development Total other controllable expenses CONTROLLABLE PROFIT Occupancy and Depreciation Expenses Occupancy Depreciation & Amortization Depreciation Amortization 52F Sunny Insurance Other (Income) Expense Other (Income) Interest Expense Other expense NET INCOME BEFORE INCOME TAXES Corporate Taxes Copyright Exhibit 2a Exhibit 2b Exhibit 2c 2,449,200 273,864 4,004 91,272 233,335 98,506 700,982 752,854 351,075 41,800 41,800 0 40,332 -21,627 21,804 3,179 316,292 4,421 Exhibit 2d Sheet1 Q Search 4,342,500 499,837 24,679 125,102 406,819 104,450 1,160,887 1,880,871 753,379 149,007 149,007 0 49,974 -38,479 37,186 929,804 74,191 31 9 0 1 12 13 14 15 16 17 18 19 20 21 22 23 24 25 26 27 28 29 30 31 32 33 A X fx Capital Stock Beginning Balance Stock Issued Ending Balance Reinvested Earnings Beginning Balance Net Income Exhibit 2c Unaudited Consolidated Statements of Retained Earnings and Stockholders' Equi Dividends B Ending Balance Accumulated Other Comprehensive Income (loss) Beginning Balance Net foreign currency translation Ending Balance Total Shareholders' Equity Source: Company documents. 12/31/2012 1,886,504 1,886,504 (1,780,234) 311,871 (1,468,363) D 418,141 12/31/2013 1,886,504 1,886,504 (1,484,770) 855,613 (629,158) E 1,257,346 3 4 5 6 7 8 9 60 31 32 33 34 35 36 37 A X fx Cash Flows from Operating Activities Net Income Adjustments to reconcile net income to net cash provided (used) by operating activities: Depreciation and amortization expense Other Decrease (increase) in: Affiliated receivable B Prepaid expenses and other receivables Accounts receivables Intercompany receivables Deposits Inventory Increase (decrease) in: Compensation payable Intercompany payables Accounts payable and accrued expenses Deferred rent payables Advanced receipts Corporate tax payable Loans payable short term Interest payable Total Adjustments Net cash provided (used) by operating activities Cash Flows from Investing Activities Purchase of fixed assets Leasehold improvements Net cash provided by (used in) investing activities Cash Flows from Financing Activities Proceeds (payments) on long-term loan 12/31/2012 311,871 (227) 7,782 (17,677) (16,875) (4,597) 558 (22) 270,000 1,750 240,692 552,563 (15,197) (127,015) (142,212) (24,540) D 12/31/2013 855,613 149,007 (135,267) (5,666) (110,847) (45,709) (68,577) 281,383 63,837 5,328 (12,520) 184,065 1,039,678 (394,150) (800,244) (1,194,393) 222,634 mm A X fx Leasehold improvements B Net cash provided by (used in) investing activities Cash Flows from Financing Activities Proceeds (payments) on long-term loan Net cash provided by (used in) financing activities Net increase (decrease) in cash and cash equivalents Cash, beginning of period Cash, end of period Source: Company documents. 27,015) (142,212) (24,540) (24,540) 385,811 138,975 524,785 D (800,244) (1,194,393) 222,634 222,634 67,919 644,092 712,011 E
Step by Step Solution
3.37 Rating (147 Votes )
There are 3 Steps involved in it

Get step-by-step solutions from verified subject matter experts