

Question: Refer to Fig. 4 . 3 . Prove mathematically that, all else being equal, the standard deviation of the response distribution is highest when
Refer to Fig. Prove mathematically that, all else being equal, the standard deviation of the response distribution is highest when sigma sigma s
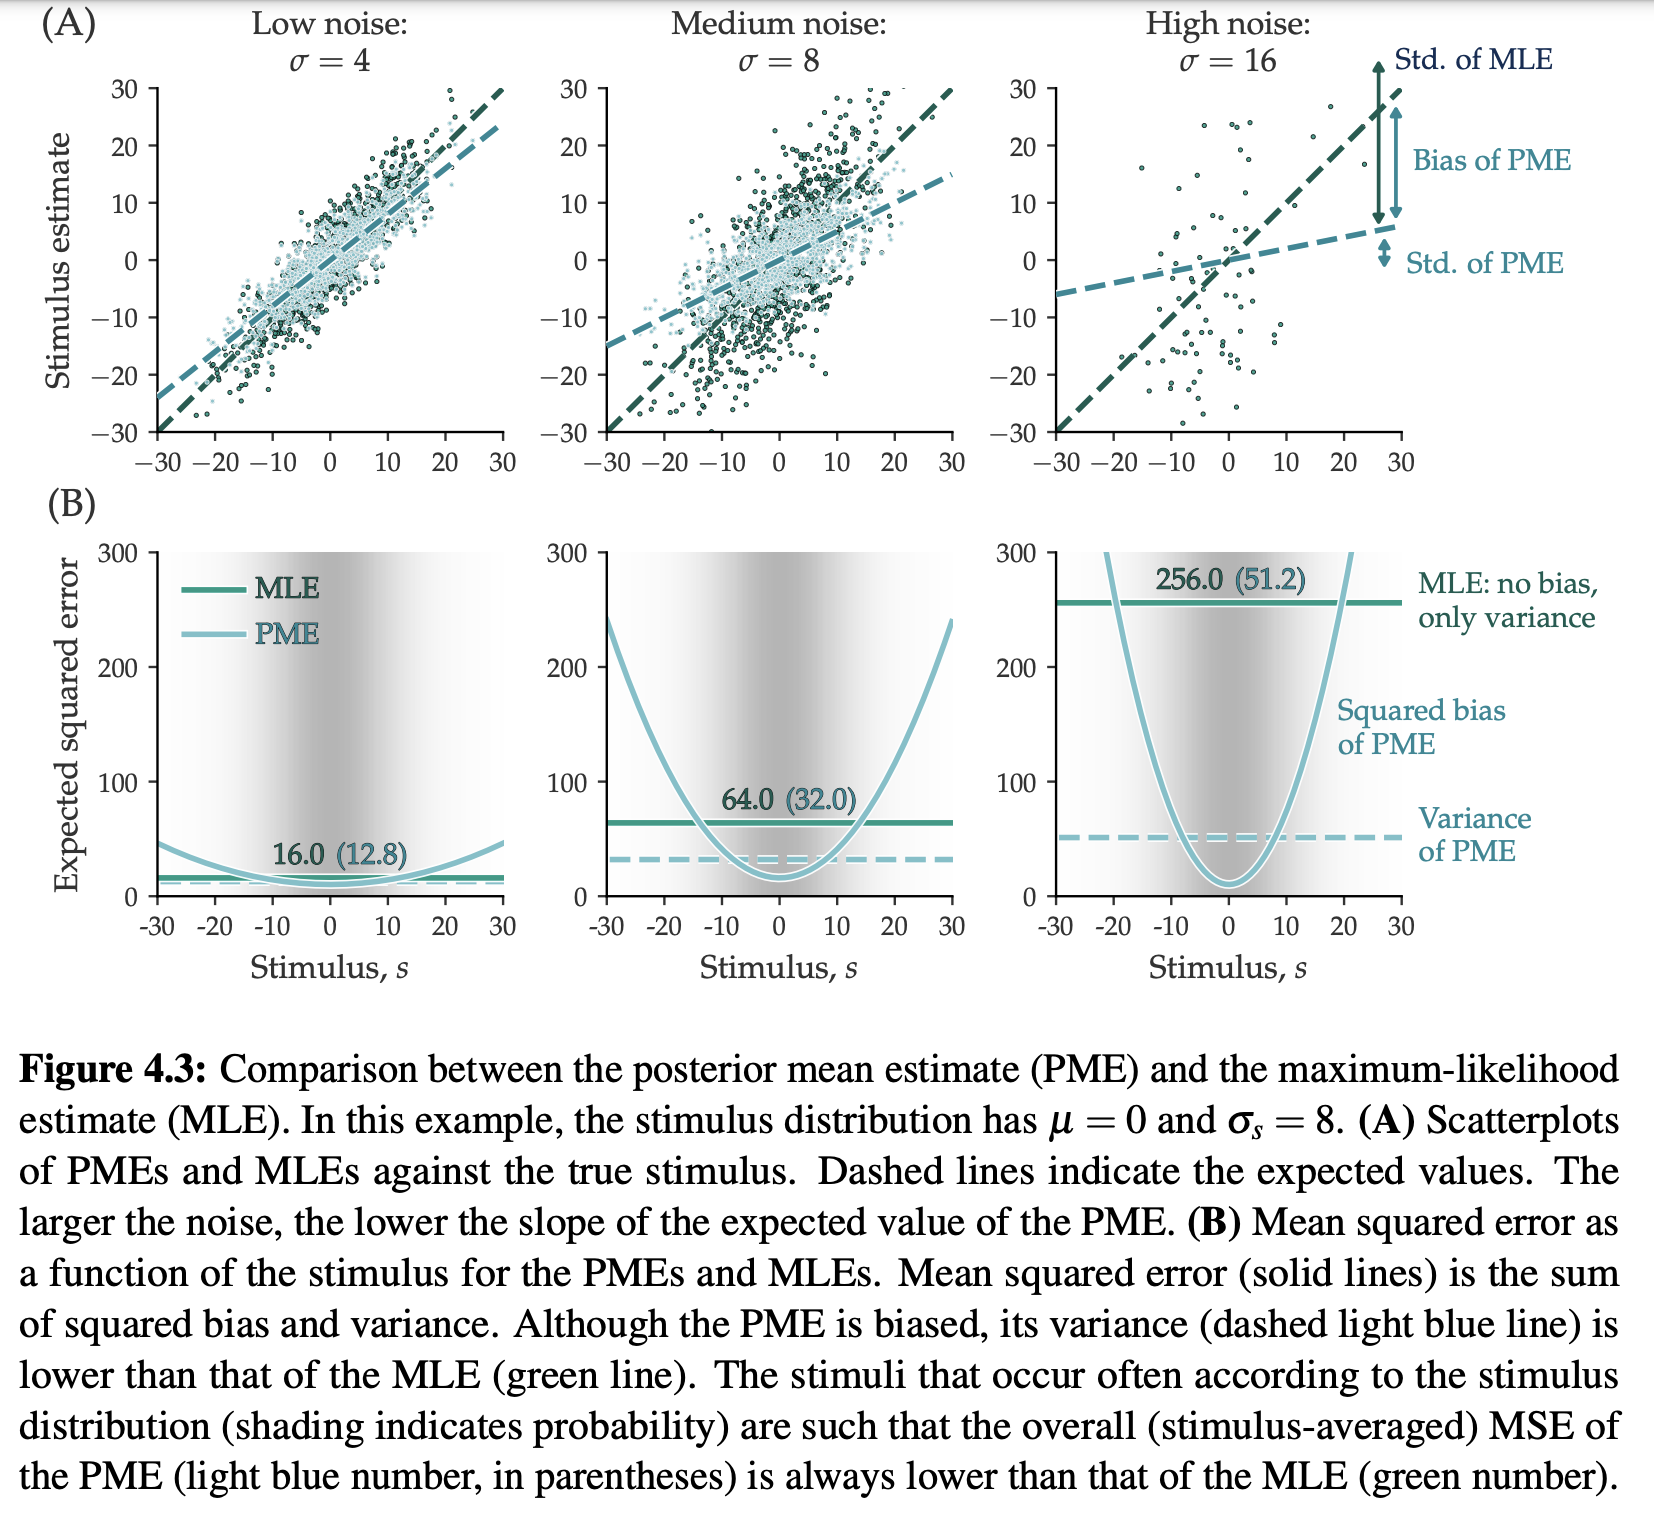
Hint: at the maximum of a function, what is the value of the derivative? Figure : Comparison between the posterior mean estimate PME and the maximumlikelihood
estimate MLE In this example, the stimulus distribution has and A Scatterplots
of PMEs and MLEs against the true stimulus. Dashed lines indicate the expected values. The
larger the noise, the lower the slope of the expected value of the PME. B Mean squared error as
a function of the stimulus for the PMEs and MLEs. Mean squared error solid lines is the sum
of squared bias and variance. Although the PME is biased, its variance dashed light blue line is
lower than that of the MLE green line The stimuli that occur often according to the stimulus
distribution shading indicates probability are such that the overall stimulusaveraged MSE of
the PME light blue number, in parentheses is always lower than that of the MLE green number
Step by Step Solution
There are 3 Steps involved in it
1 Expert Approved Answer
Step: 1 Unlock

Question Has Been Solved by an Expert!
Get step-by-step solutions from verified subject matter experts
Step: 2 Unlock
Step: 3 Unlock