

Question: Refer to Figure 7-3 . Which area represents the increase in consumer surplus when the price falls from P1 to P2? Group of answer choices
Refer to Figure 7-3. Which area represents the increase in consumer surplus when the price falls from P1 to P2?
Group of answer choices
ACG
BCGD
DFG
ABD
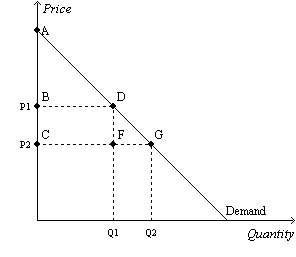
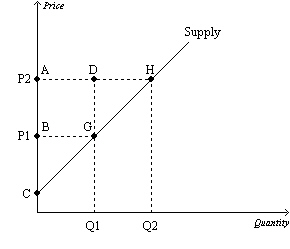
`Price D P1 C P2 Demand Q1 02 QuantityPrice Supply D H P2 B P1 C Q1 Q2 Quantity
Step by Step Solution
There are 3 Steps involved in it
1 Expert Approved Answer
Step: 1 Unlock

Question Has Been Solved by an Expert!
Get step-by-step solutions from verified subject matter experts
Step: 2 Unlock
Step: 3 Unlock