

Question: Refer to Table 1 on the Excel file. Using a regression analysis on the entire quarterly income data, what is MCI s exposure to the
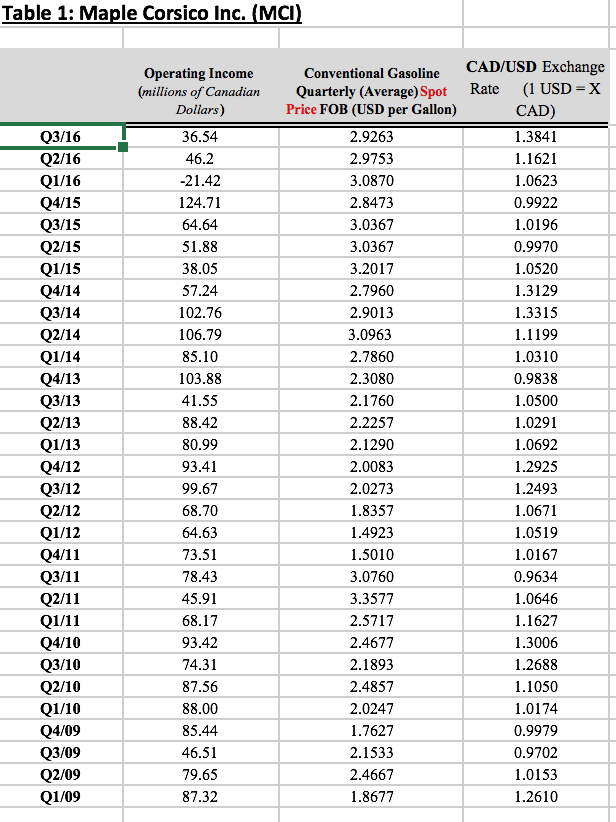
"Refer to Table 1 on the Excel file. Using a regression analysis on the entire quarterly income data, what is MCI s exposure to the USD dollar exchange rate risk? In your answer, be sure to interpret what the results of the regression analysis mean." For the toolbar, press ALT+F10 (PC) or ALT+FN+F10 (Mac). B I Paragraph Arial 14px > iii III > A T: ... P O WORDS POWERED BY TINY Table 1: Maple Corsico Inc. (MCI) Q3/16 Q2/16 Q1/16 Q4/15 Q3/15 Q2/15 Q1/15 Q4/14 Q3/14 Q2/14 Q1/14 Q4/13 Q3/13 Q2/13 Q1/13 Q4/12 Q3/12 Q2/12 Q1/12 Q4/11 Q3/11 Q2/11 Q1/11 Q4/10 03/10 Q2/10 01/10 Q4/09 Q3/09 Q2/09 Q1/09 Operating Income (millions of Canadian Dollars) 36.54 46.2 -21.42 124.71 64.64 51.88 38.05 57.24 102.76 106.79 85.10 103.88 41.55 88.42 80.99 93.41 99.67 68.70 64.63 73.51 78.43 45.91 68.17 93.42 74.31 87.56 88.00 85.44 46.51 79.65 87.32 Conventional Gasoline Quarterly (Average) Spot Price FOB (USD per Gallon) 2.9263 2.9753 3.0870 2.8473 3.0367 3.0367 3.2017 2.7960 2.9013 3.0963 2.7860 2.3080 2.1760 2.2257 2.1290 2.0083 2.0273 1.8357 1.4923 1.5010 3.0760 3.3577 2.5717 2.4677 2.1893 2.4857 2.0247 1.7627 2.1533 2.4667 1.8677 CAD/USD Exchange Rate (1 USD = X CAD) 1.3841 1.1621 1.0623 0.9922 1.0196 0.9970 1.0520 1.3129 1.3315 1.1199 1.0310 0.9838 1.0500 1.0291 1.0692 1.2925 1.2493 1.0671 1.0519 1.0167 0.9634 1.0646 1.1627 1.3006 1.2688 1.1050 1.0174 0.9979 0.9702 1.0153 1.2610 "Refer to Table 1 on the Excel file. Using a regression analysis on the entire quarterly income data, what is MCI s exposure to the USD dollar exchange rate risk? In your answer, be sure to interpret what the results of the regression analysis mean." For the toolbar, press ALT+F10 (PC) or ALT+FN+F10 (Mac). B I Paragraph Arial 14px > iii III > A T: ... P O WORDS POWERED BY TINY Table 1: Maple Corsico Inc. (MCI) Q3/16 Q2/16 Q1/16 Q4/15 Q3/15 Q2/15 Q1/15 Q4/14 Q3/14 Q2/14 Q1/14 Q4/13 Q3/13 Q2/13 Q1/13 Q4/12 Q3/12 Q2/12 Q1/12 Q4/11 Q3/11 Q2/11 Q1/11 Q4/10 03/10 Q2/10 01/10 Q4/09 Q3/09 Q2/09 Q1/09 Operating Income (millions of Canadian Dollars) 36.54 46.2 -21.42 124.71 64.64 51.88 38.05 57.24 102.76 106.79 85.10 103.88 41.55 88.42 80.99 93.41 99.67 68.70 64.63 73.51 78.43 45.91 68.17 93.42 74.31 87.56 88.00 85.44 46.51 79.65 87.32 Conventional Gasoline Quarterly (Average) Spot Price FOB (USD per Gallon) 2.9263 2.9753 3.0870 2.8473 3.0367 3.0367 3.2017 2.7960 2.9013 3.0963 2.7860 2.3080 2.1760 2.2257 2.1290 2.0083 2.0273 1.8357 1.4923 1.5010 3.0760 3.3577 2.5717 2.4677 2.1893 2.4857 2.0247 1.7627 2.1533 2.4667 1.8677 CAD/USD Exchange Rate (1 USD = X CAD) 1.3841 1.1621 1.0623 0.9922 1.0196 0.9970 1.0520 1.3129 1.3315 1.1199 1.0310 0.9838 1.0500 1.0291 1.0692 1.2925 1.2493 1.0671 1.0519 1.0167 0.9634 1.0646 1.1627 1.3006 1.2688 1.1050 1.0174 0.9979 0.9702 1.0153 1.2610
Step by Step Solution
There are 3 Steps involved in it

Get step-by-step solutions from verified subject matter experts