

Question: Refer to Table 1 on the Excel file. Using the data from 2009 Q2 to 2016 Q3, what is the expected quarterly percentage price change
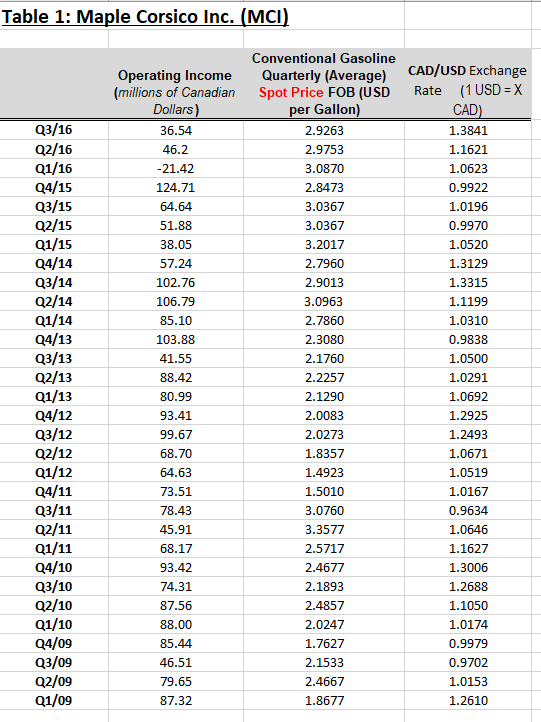
Refer to Table 1 on the Excel file. Using the data from 2009 Q2 to 2016 Q3, what is the expected quarterly percentage price change for gasoline (FOB)? Your answer should be to two decimal places with no percentage symbol. For example three and a half percent =3.50 A Using the data from 2009 Q2 to 2016 Q3, what is the volatility of the price change for gasoline (FOB)? A Question 11 (Mandatory) (2 points) Refer to Table 1 on the Excel file. Using the data from 2009 Q2 to 2016 Q3 to get the expected percentage price change and volatility, what is the probability of seeing the CAD/USD exchange rate increase by more than 5% ? 34.1% 40.6% 65.9% 15.9% 52.0% Question 12 (Mandatory) (3 points) Refer to Table 1 on the Excel file. 2. Using a regression analysis of the entire quarterly income data on the CAD/USD rate (only), what is MCl s exposure to the USD dollar exchange rate risk? In your answer, be sure to interpret what the results of the regression analysis mean. Table 1: Maple Corsico Inc. (MCl)
Step by Step Solution
There are 3 Steps involved in it

Get step-by-step solutions from verified subject matter experts