Question: Refer to Table 56.1. Factors for Computing Control Chart Limits (3 sigma) for this problem. West Battery Corp. has recently been receiving complaints from retailers
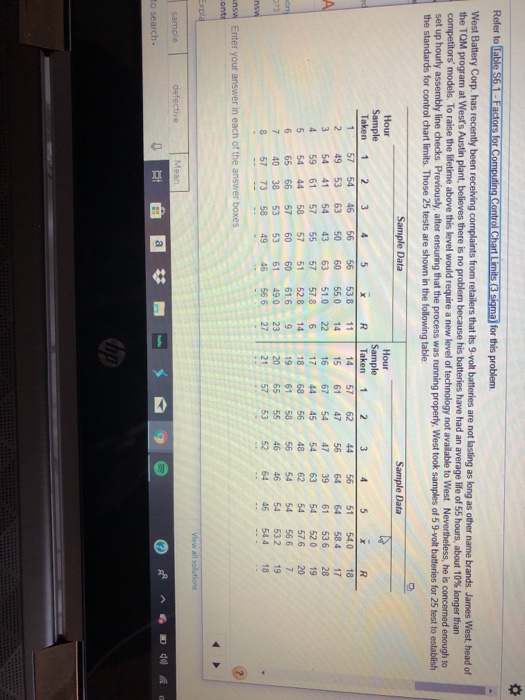
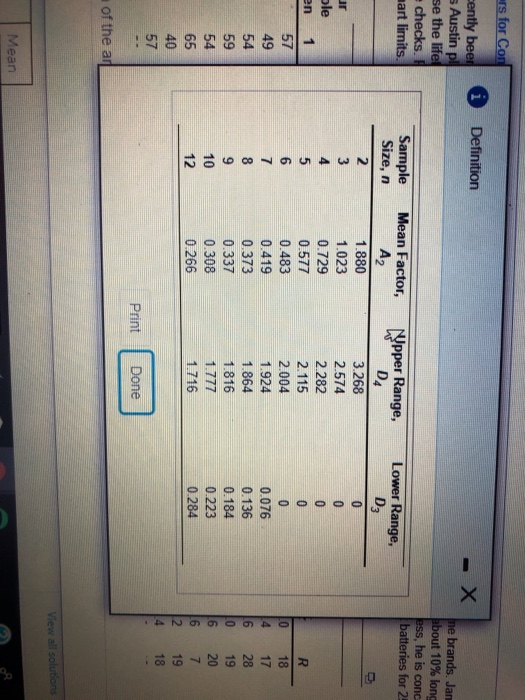
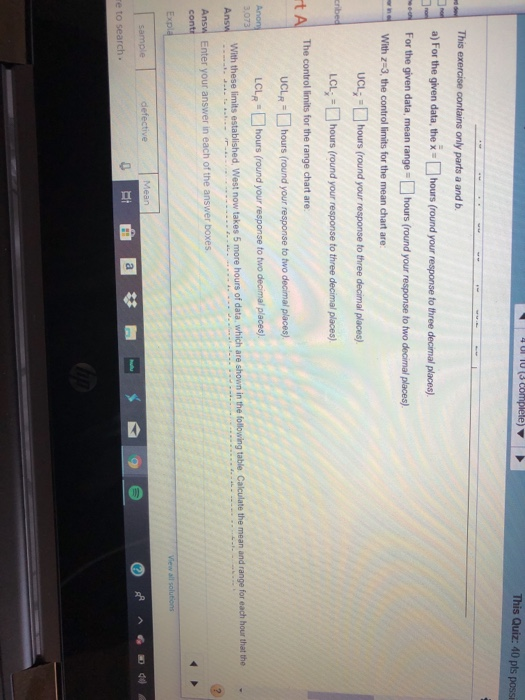
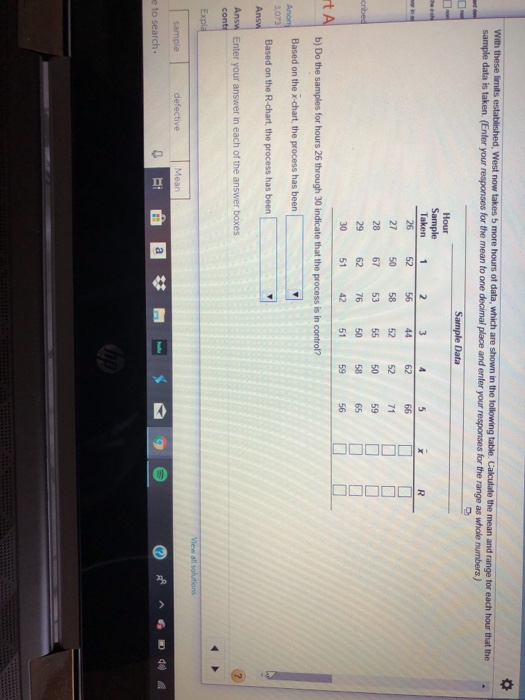
Refer to Table 56.1. Factors for Computing Control Chart Limits (3 sigma) for this problem. West Battery Corp. has recently been receiving complaints from retailers that its 9-volt batteries are not lasting as long as other name brands. James West head of the TQM program at West's Austin plant, believes there is no problem because his batteries have had an average life of 55 hours, about 10% longer than competitors' models. To raise the lifetime above this level would require a new level of technology not available to West. Nevertheless, he is concerned enough to set up hourly assembly line checks. Previously, after ensuring that the process was running properly, West took samples of 5 9-volt batteries for 25 test to establish the standards for control chart limits. Those 25 tests are shown in the following table: Sample Data Sample Data Hour Sample Taken 1 2 3 4 5 6 7 1 57 49 54 59 54 65 40 57 2 54 53 41 61 44 66 38 73 3 4 5 46 56 56 63 50 60 54 43 63 57 55 57 58 57 51 57 6060 535361 58 49 46 X R 53.8 11 55.0 14 51.0 22 578 6 528 14 61.6 9 49.0 23 56.6 27 Hour Sample Taken 1 14 57 1561 16 67 1 7 44 18 68 19 61 20 65 21 57 2 3 62 44 4756 54 47 45 54 56 48 58 56 55 46 53 52 4 56 64 39 63 62 54 46 64 5 x 51 54.0 64 58.4 61 53.6 54 520 54 57.6 54 566 54 532 4654.4 R 18 17 28 19 20 7 19 18 Answ Enter your answer in each of the answer boxes ontt View all solutions sample defective Mean to search ars for Con 1 Definition cently beer Austin pl se the life checks. mart limits ne brands. Jan about 10% long ess, he is conc batteries for 2 Sample Size, n Lower Range, ur ble en Mean Factor, A2 1.880 1.023 0.729 0.577 0.483 0.419 0.373 0.337 0.308 0.266 Nocow Nypper Range, D4 3.268 2.574 2.282 2.115 2.004 1.924 1.864 1.816 1.777 1.716 gooooo 0.076 0.136 0.184 0.223 0.284 ANOOGAO Done of the View all solutions Mean 10 (3 Complete) This Quiz: 40 pls poss This exercise contains only parts a and b. a) For the given data, the x = hours (round your response to three decimal places) For the given data, mean range hours (round your response to two decimal places) With z=3, the control limits for the mean chart are: UCL - hours (round your response to three decimal places) cribed LCL = hours (round your response to three decimal places) + The control limits for the range chart are: UCLR hours (round your response to two decimal places) Anond 3073 LCLR" hours (round your response to two decimal places). With these limits established, West now takes 5 more hours of data which are shown in the following table Calculate the mean and range for each hour that the Ans Answ Enter your answer in each of the answer boxes conti Expl View all solutions sample defective Mean Te to search With these limits established, West now takes 5 more hours of data, which are shown in the following table. Calculate the mean and range for each hour that the sample data is taken (Enter your responses for the mean to one decimal place and enter your responses for the range as whole numbers.) Sample Data Hour Sample Taken 1 26 27 50 28 67 2962 30 51 53 cribed 42 51 rt A b) Do the samples for hours 26 through 30 indicate that the process is in control? Based on the x-chart, the process has been Anon 3,073 Based on the R-chart, the process has been Ans Answ Enter your answer in each of the answer boxes conti Expl View all solutions sample defective Mean e to search Refer to Table 56.1. Factors for Computing Control Chart Limits (3 sigma) for this problem. West Battery Corp. has recently been receiving complaints from retailers that its 9-volt batteries are not lasting as long as other name brands. James West head of the TQM program at West's Austin plant, believes there is no problem because his batteries have had an average life of 55 hours, about 10% longer than competitors' models. To raise the lifetime above this level would require a new level of technology not available to West. Nevertheless, he is concerned enough to set up hourly assembly line checks. Previously, after ensuring that the process was running properly, West took samples of 5 9-volt batteries for 25 test to establish the standards for control chart limits. Those 25 tests are shown in the following table: Sample Data Sample Data Hour Sample Taken 1 2 3 4 5 6 7 1 57 49 54 59 54 65 40 57 2 54 53 41 61 44 66 38 73 3 4 5 46 56 56 63 50 60 54 43 63 57 55 57 58 57 51 57 6060 535361 58 49 46 X R 53.8 11 55.0 14 51.0 22 578 6 528 14 61.6 9 49.0 23 56.6 27 Hour Sample Taken 1 14 57 1561 16 67 1 7 44 18 68 19 61 20 65 21 57 2 3 62 44 4756 54 47 45 54 56 48 58 56 55 46 53 52 4 56 64 39 63 62 54 46 64 5 x 51 54.0 64 58.4 61 53.6 54 520 54 57.6 54 566 54 532 4654.4 R 18 17 28 19 20 7 19 18 Answ Enter your answer in each of the answer boxes ontt View all solutions sample defective Mean to search ars for Con 1 Definition cently beer Austin pl se the life checks. mart limits ne brands. Jan about 10% long ess, he is conc batteries for 2 Sample Size, n Lower Range, ur ble en Mean Factor, A2 1.880 1.023 0.729 0.577 0.483 0.419 0.373 0.337 0.308 0.266 Nocow Nypper Range, D4 3.268 2.574 2.282 2.115 2.004 1.924 1.864 1.816 1.777 1.716 gooooo 0.076 0.136 0.184 0.223 0.284 ANOOGAO Done of the View all solutions Mean 10 (3 Complete) This Quiz: 40 pls poss This exercise contains only parts a and b. a) For the given data, the x = hours (round your response to three decimal places) For the given data, mean range hours (round your response to two decimal places) With z=3, the control limits for the mean chart are: UCL - hours (round your response to three decimal places) cribed LCL = hours (round your response to three decimal places) + The control limits for the range chart are: UCLR hours (round your response to two decimal places) Anond 3073 LCLR" hours (round your response to two decimal places). With these limits established, West now takes 5 more hours of data which are shown in the following table Calculate the mean and range for each hour that the Ans Answ Enter your answer in each of the answer boxes conti Expl View all solutions sample defective Mean Te to search With these limits established, West now takes 5 more hours of data, which are shown in the following table. Calculate the mean and range for each hour that the sample data is taken (Enter your responses for the mean to one decimal place and enter your responses for the range as whole numbers.) Sample Data Hour Sample Taken 1 26 27 50 28 67 2962 30 51 53 cribed 42 51 rt A b) Do the samples for hours 26 through 30 indicate that the process is in control? Based on the x-chart, the process has been Anon 3,073 Based on the R-chart, the process has been Ans Answ Enter your answer in each of the answer boxes conti Expl View all solutions sample defective Mean e to search