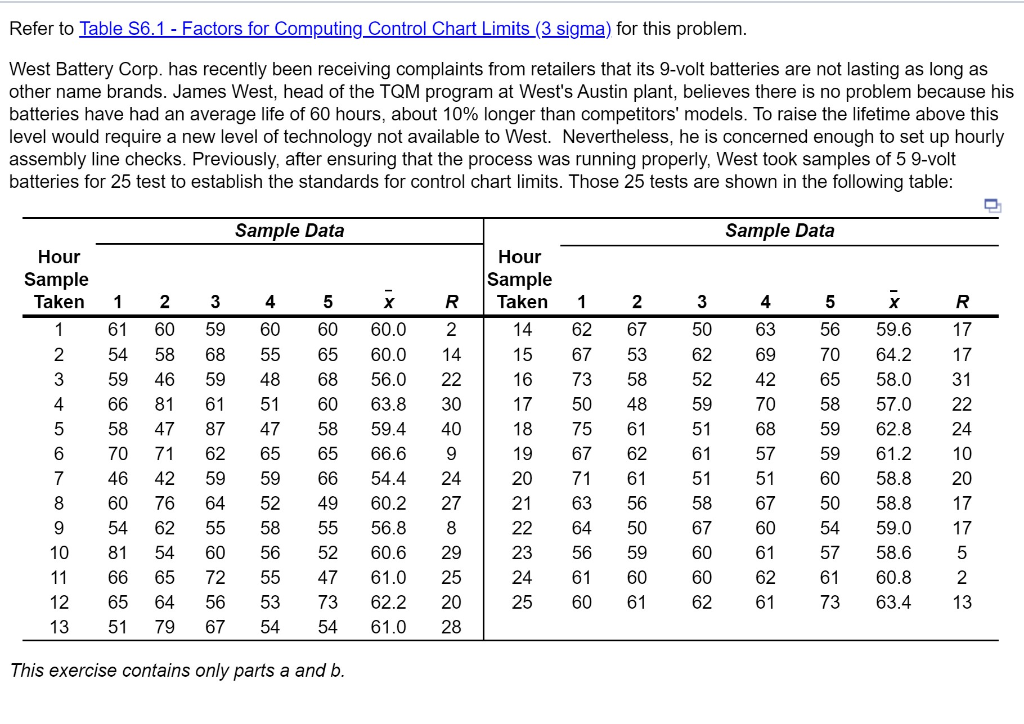
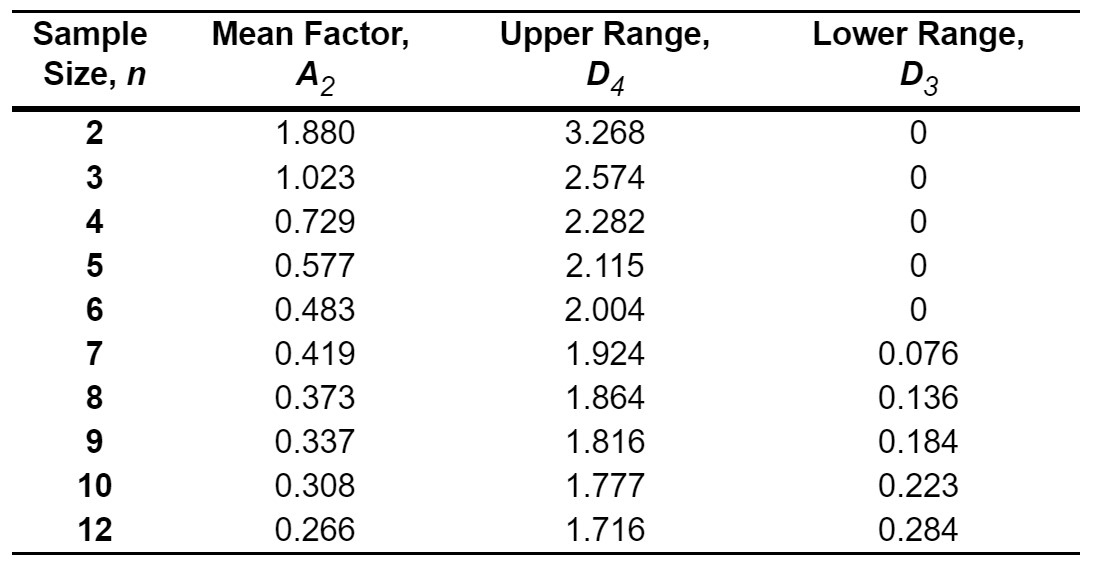
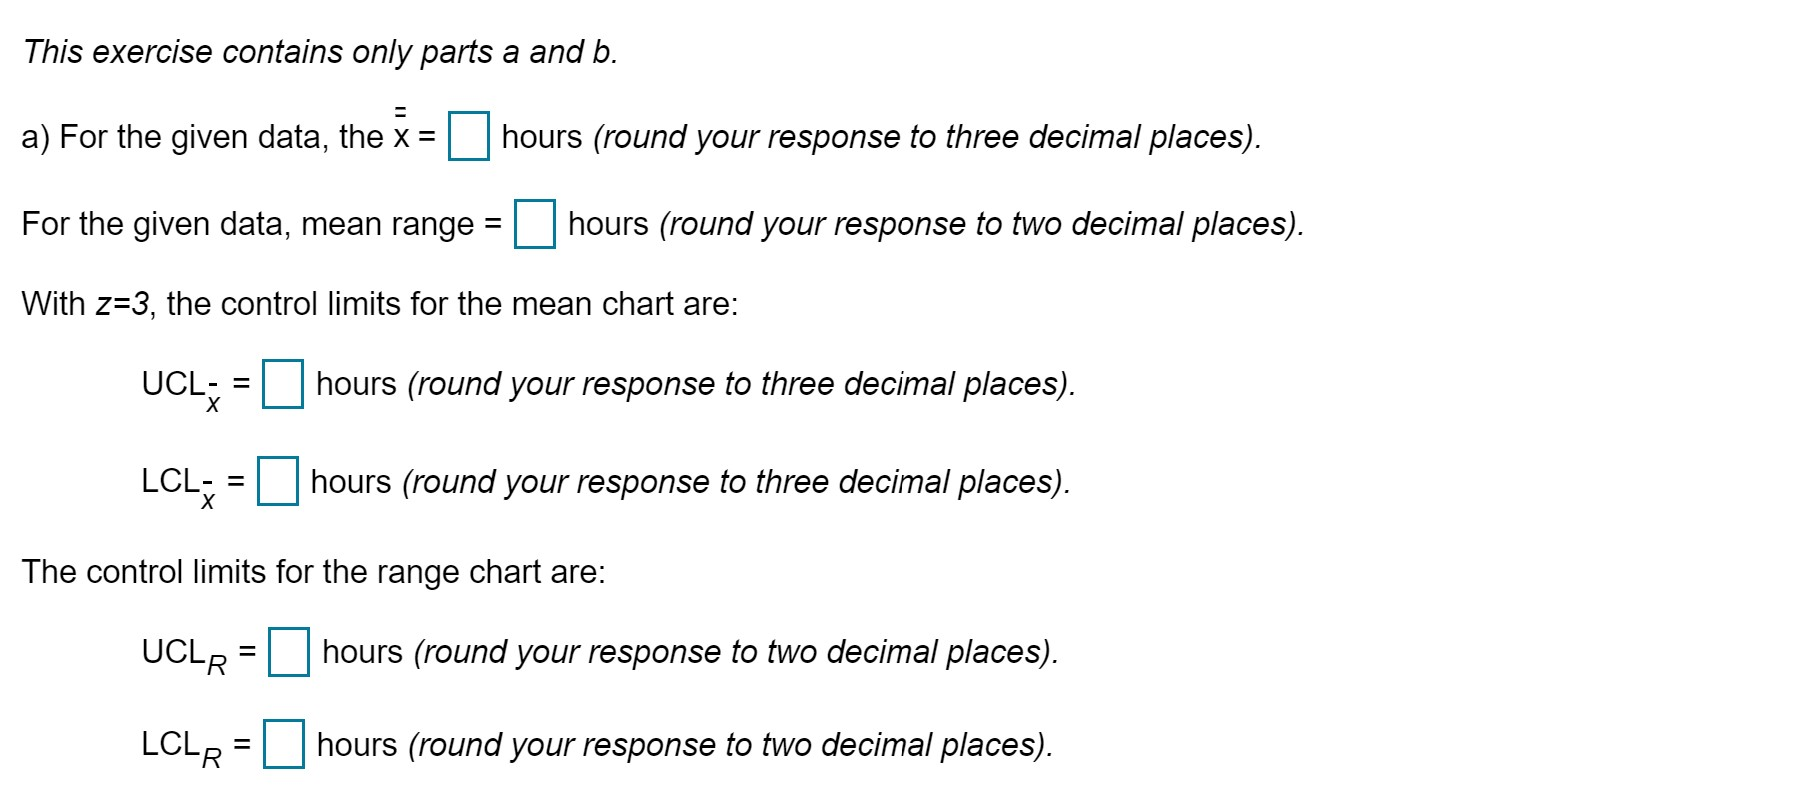
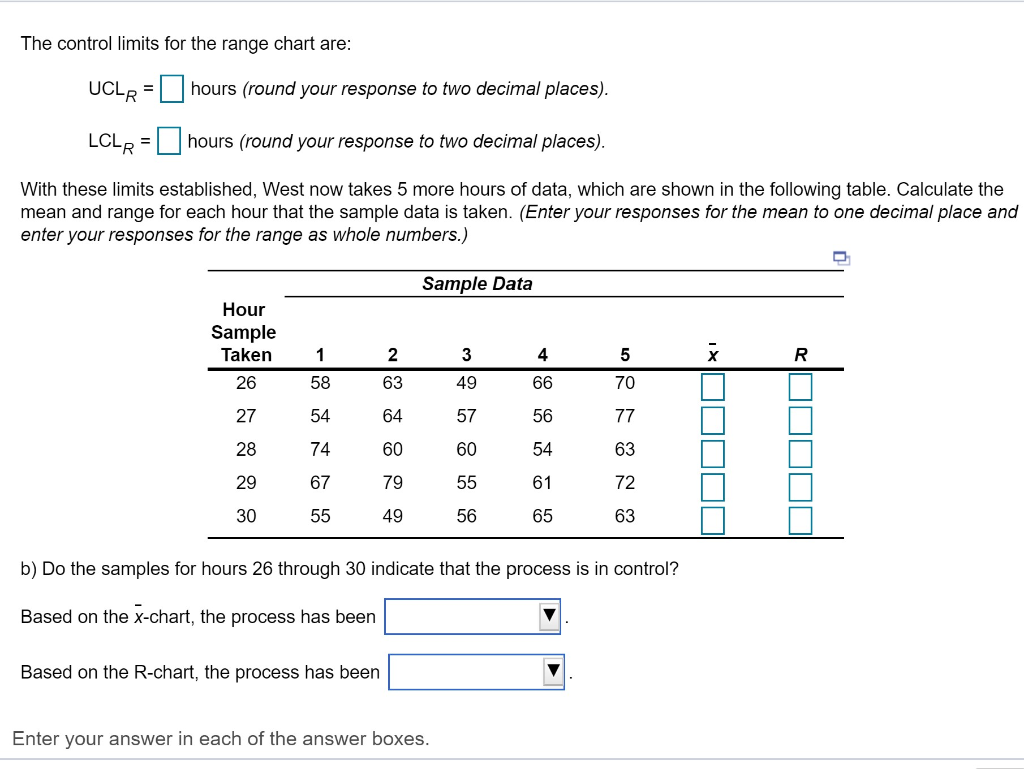
Question: Refer to Table 56.1 - Factors for Computing Control Chart Limits (3 sigma) for this problem. West Battery Corp. has recently been receiving complaints from

Refer to Table 56.1 - Factors for ComputingRefer to Table 56.1 - Factors for ComputingRefer to Table 56.1 - Factors for ComputingRefer to Table 56.1 - Factors for Computing

Refer to Table 56.1 - Factors for Computing Control Chart Limits (3 sigma) for this problem. West Battery Corp. has recently been receiving complaints from retailers that its 9-volt batteries are not lasting as long as other name brands. James West, head of the TQM program at West's Austin plant, believes there is no problem because his batteries have had an average life of 60 hours, about 10% longer than competitors' models. To raise the lifetime above this level would require a new level of technology not available to West. Nevertheless, he is concerned enough to set up hourly assembly line checks. Previously, after ensuring that the process was running properly, West took samples of 5 9-volt batteries for 25 test to establish the standards for control chart limits. Those 25 tests are shown in the following table: Sample Data Sample Data 2 67 53 3 50 4 63 5 56 70 65 58 R 17 17 31 22 Hour Sample Taken 1 2 61 60 54 58 59 46 4 66 81 5 58 47 6 70 71 7 46 42 8 60 76 9 54 62 10 81 54 11 66 65 12 65 64 13 51 79 o ovo AWN+ 3 59 68 59 61 87 62 59 64 55 60 72 56 67 4 5 60 60 5565 48 68 51 60 47 58 65 65 59 66 52 49 58 55 56 52 55 47 53 73 54 54 60.0 60.0 56.0 63.8 59.4 66.6 54.4 60.2 56.8 60.6 61.0 62.2 61.0 R 2 14 22 30 40 9 24 27 8 29 25 20 28 Hour Sample Taken 1 14 62 15 67 16 73 17 50 18 75 1967 20 71 21 63 22 64 23 56 61 25 60 X 59.6 64.2 58.0 57.0 62.8 61.2 58.8 58.8 59.0 58.6 60.8 63.4 60 50 20 17 56 50 59 60 61 60 60 62 61 62 61 57 61 73 5 2 13 This exercise contains only parts a and b. Sample Size, n Mean Factor, Upper Range, Lower Range, A2 D4 Doco voo AWN 1.880 1.023 0.729 0.577 0.483 0.419 0.373 0.337 0.308 0.266 3.268 2.574 2.282 2.115 2.004 1.924 1.864 1.816 1.777 1.716 0.076 0.136 0.184 0.223 0.284 This exercise contains only parts a and b. a) For the given data, the x = hours (round your response to three decimal places). For the given data, mean range = hours (round your response to two decimal places). With z=3, the control limits for the mean chart are: UCL; = |hours (round your response to three decimal places). LCL- = |hours (round your response to three decimal places). The control limits for the range chart are: UCLR = hours (round your response to two decimal places). LCLR = hours (round your response to two decimal places). The control limits for the range chart are: UCLR = hours (round your response to two decimal places). LCLR = hours (round your response to two decimal places). With these limits established, West now takes 5 more hours of data, which are shown in the following table. Calculate the mean and range for each hour that the sample data is taken. (Enter your responses for the mean to one decimal place and enter your responses for the range as whole numbers.) Sample Data 4 26 Hour Sample Taken 1 58 - 54 28 74 67 55 2 63 64 60 79 49 3 49 57 60 55 56 54 61 65 OOOOO b) Do the samples for hours 26 through 30 indicate that the process is in control? Based on the x-chart, the process has been Based on the R-chart, the process has been Enter your answer in each of the answer boxes

Step by Step Solution

There are 3 Steps involved in it

1 Expert Approved Answer
Step: 1 Unlock blur-text-image
Question Has Been Solved by an Expert!

Get step-by-step solutions from verified subject matter experts

Step: 2 Unlock
Step: 3 Unlock

Students Have Also Explored These Related General Management Questions!