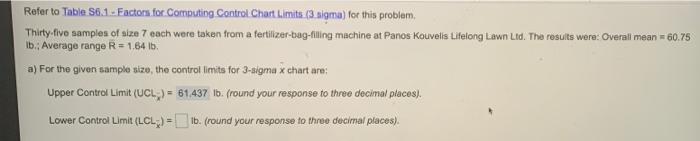
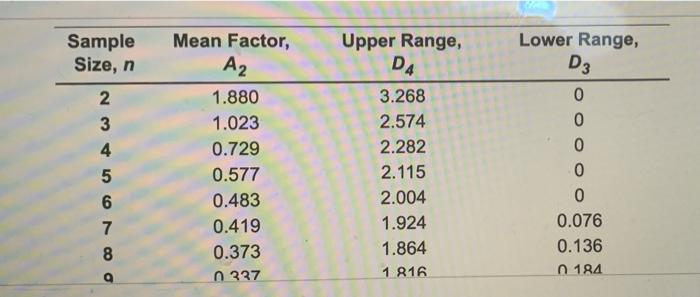
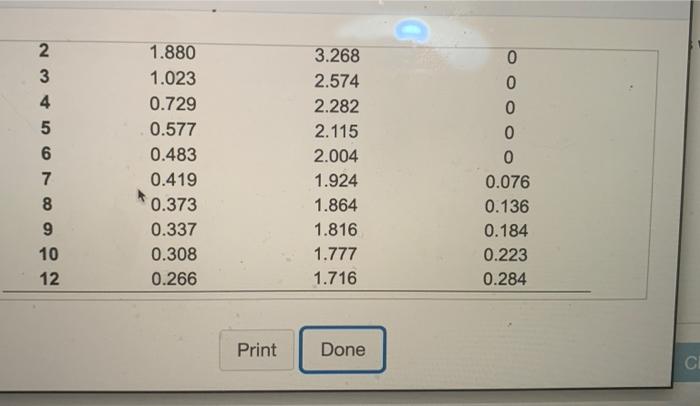
Question: Refer to Table 56.1. Factors for Computing Control Chart Limits (3.sigma) for this problem Thirty-five samples of size 7 each were taken from a fertilizer-bag-filing

Refer to Table 56.1. Factors for Computing
Refer to Table 56.1. Factors for Computing Control Chart Limits (3.sigma) for this problem Thirty-five samples of size 7 each were taken from a fertilizer-bag-filing machine at Panos Kouvelis Lifelong Lawn Ltd. The results were: Overall mean = 60.75 Ib. Average range R=1,64 16. a) For the given sample size, the controllimits for 3-sigma x chart are; Upper Control Limit (UCL;) = 61,437 16. (round your response to three decimal places). Lower Control Limit (LCL) = 1b. (round your response to three decimal places). Lower Range, Sample Size, n Upper Range, D4 D3 0 2 3 4 5 6 7 8 Mean Factor, A2 1.880 1.023 0.729 0.577 0.483 0.419 0.373 n 337 3.268 2.574 2.282 2.115 2.004 1.924 1.864 1 816 0 0 0 0 0.076 0.136 n 184 @ 2 3 4 5 6 7 8 9 10 12 1.880 1.023 0.729 0.577 0.483 0.419 0.373 0.337 0.308 0.266 3.268 2.574 2.282 2.115 2.004 1.924 1.864 1.816 1.777 1.716 0 0 0 0 0 0.076 0.136 0.184 0.223 0.284 Print Done CI

Step by Step Solution

There are 3 Steps involved in it

1 Expert Approved Answer
Step: 1 Unlock blur-text-image
Question Has Been Solved by an Expert!

Get step-by-step solutions from verified subject matter experts

Step: 2 Unlock
Step: 3 Unlock

Students Have Also Explored These Related General Management Questions!