

Question: Refer to Table 56.1-Factors for Computing Control Chart Limits (3 sigma) for this problem. A process that is considered to be in control measures an
Refer to Table 56.1-Factors for Computing Control Chart Limits (3 sigma) for this problem. A process that is considered to be in control measures an ingredient in ounces. Below are the last 10 samples (each of size n = 5) taken. The population process standard deviation 1.36. c) The control limits for the R-chart are: ulator 1 11 10 9 9 11 = 2 Ask my instructor 9910 LCL;= = 8.256 ounces (round your response to three decimal places). F: 3 13 8 11 UCLR ounces (round your response to three decimal places). 10 10 11 10 10 11 a) Standard deviation of the sampling means = 0.608 ounces (round your response to three decimal places). b) With z= 3, the control limits for the mean chart are: UCL = 11.904 ounces (round your response to three decimal aces). Samples 4 5 6 11 12 11 11 10 9 11 9 7 12 9 11 9 7 9 12 9 7 8 8 12 26797 16 9 8 9 13 13 10 10 10 13 9 8 12 C Clear all Check answer
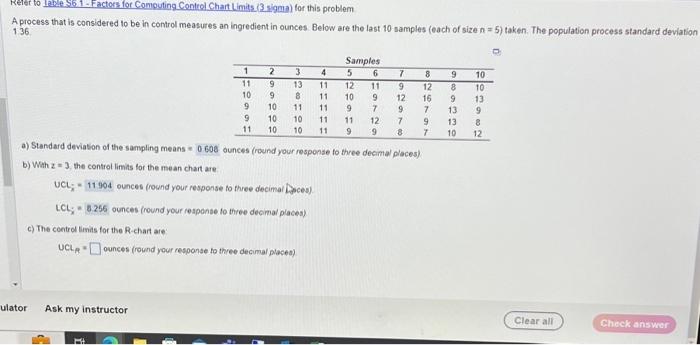
Reret to Iape-S6 1- Factose for Comouting Control Chart Limits, 3 sigma) for this problem A process that is considered to be in control measures an ingredient in ounces. Below are the last 10 samples (each of size n=5 ) taken. The population process standard deviation 136 a) Standard deviation of the sampling means = 0 E08 ounces (round your response to three decimal places) b) With z=3, the control limits for the mean chart are. UCL;=11904ounces(roundyourresponsetothreedecimarDoces). c) The control timis for the R-char are: UCLA*ounces(roundyourresponsefotheedecimalplaces)
Step by Step Solution
There are 3 Steps involved in it
1 Expert Approved Answer
Step: 1 Unlock

Question Has Been Solved by an Expert!
Get step-by-step solutions from verified subject matter experts
Step: 2 Unlock
Step: 3 Unlock