

Question: please help !! PM III 21 PM 9 221 PM 12:13 PM Homework: Assign #6 Ch 6S Refer to Table 56.1-Factors for Computing Control Chart
please help !! 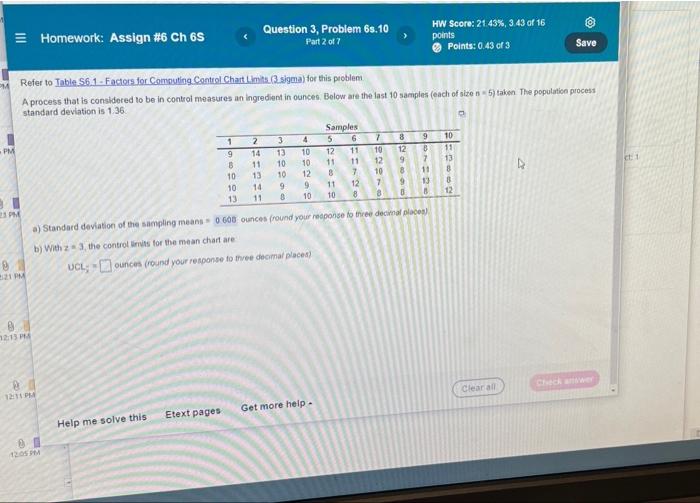
PM III 21 PM 9 221 PM 12:13 PM Homework: Assign #6 Ch 6S Refer to Table 56.1-Factors for Computing Control Chart Limits (3 sigma) for this problem A process that is considered to be in control measures an ingredient in ounces. Below are the last 10 samples (each of size n-5) taken. The population process standard deviation is nis 1.36 a 12:11 PM 11 12:05 PM 1 9 Help me solve this B 10 Etext pages Question 3, Problem 6s.10 Part 2 of 7 2 14 11 13 3 13 10 10 10 14 9 13 11 8 4 10 10 12 9 10 UCL;-ounces (round your response to three decimal places) Samples 5 6 12 11 Get more help. 8 11 10 11 HA126 11 a) Standard deviation of the sampling means 0 608 ounces (round your response to three decimal places) b) With z 3, the control limits for the mean chart are 8 9 12 10 B 12 9 7 8 11 9 13 8 B 7 P2UTO 7 10 7 HW Score: 21.43%, 3.43 of 16 points Points: 0.43 of 3 10 11 13 8 12 Clear all Save 4 et 1 Step by Step Solution
There are 3 Steps involved in it
1 Expert Approved Answer
Step: 1 Unlock

Question Has Been Solved by an Expert!
Get step-by-step solutions from verified subject matter experts
Step: 2 Unlock
Step: 3 Unlock