

Question: refer to table factors for control chart limits (3sigma) The Thirty five sample of size 7 each were taken from a fert5bag filling machine. The
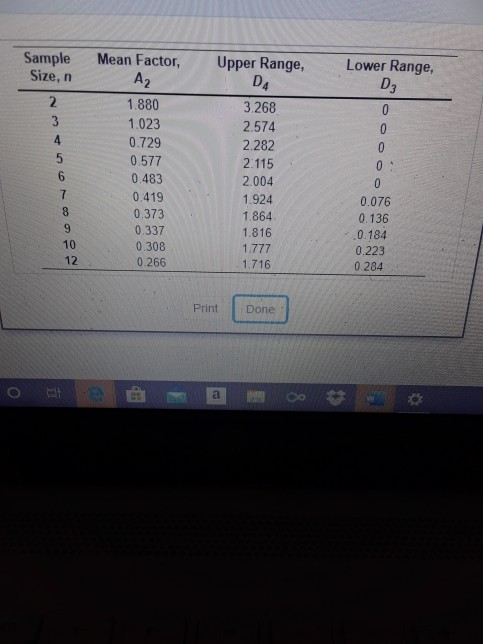
refer to table factors for control chart limits (3sigma) The Thirty five sample of size 7 each were taken from a fert5bag filling machine. The results were overall mean = 60.75lb : Average R bar = 1.54 lb A) For the given sample size the control limits for 3-sigma x chart are: Upper control limit (UCLx) = lb (round your response to three decimal places) Lower Control limit (LCLx) = lb (round your response to three decimal places)
B) the control limits for 3-sigma x chart are: Upper control limit (UCLr) = lb (round your response to three decimal places) Lower Control limit (LCLr) = lb (round your response to three decimal places)
Mean Factor, Sample Size, n Lower Range, D3 OLAWN 0 1.880 1.023 0.729 0.577 0.483 0.419 0.373 0.337 0.308 0.266 D4 3.268 2.574 2.282 2.115 2.004 1.924 1.864 1.816 1777 1.716 0.076 0.136 0.184 0.223 0.284 Print DoneStep by Step Solution
There are 3 Steps involved in it

Get step-by-step solutions from verified subject matter experts