

Question: Refer to Table S 6 . 1 - Factors for Computing Control Chart Limits A process that is considered to be in control measures an
Refer to Table S Factors for Computing Control Chart Limits
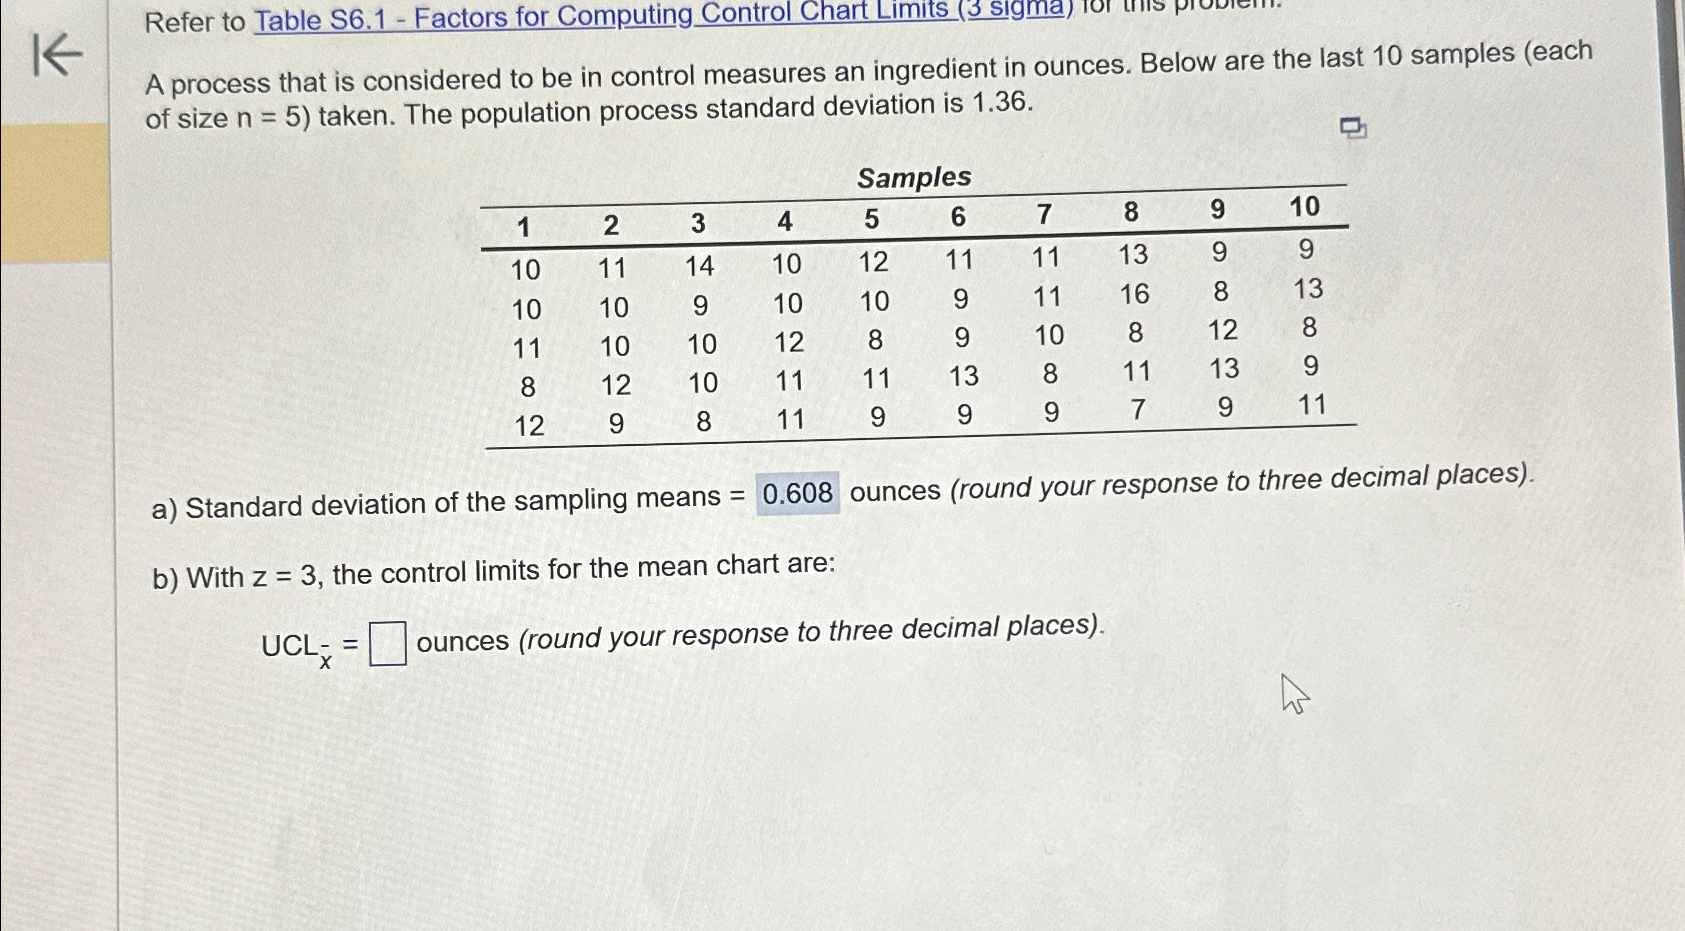
A process that is considered to be in control measures an ingredient in ounces. Below are the last samples each of size taken. The population process standard deviation is
tableSamples
Step by Step Solution
There are 3 Steps involved in it
1 Expert Approved Answer
Step: 1 Unlock

Question Has Been Solved by an Expert!
Get step-by-step solutions from verified subject matter experts
Step: 2 Unlock
Step: 3 Unlock