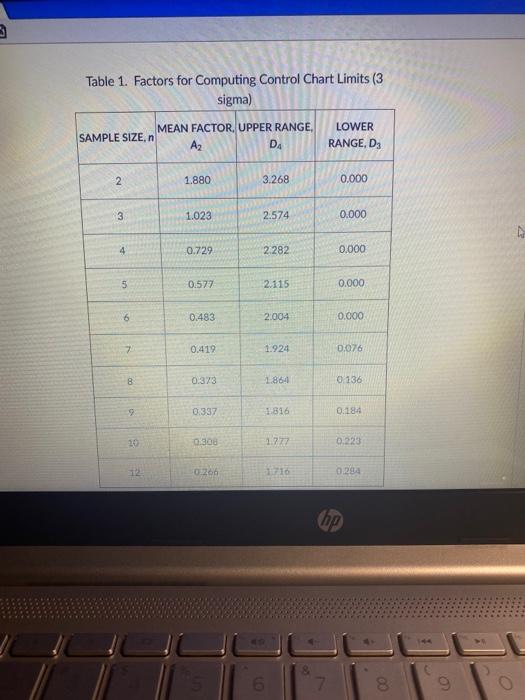
Question: Table 1. Factors for Computing Control Chart Limits (3 sigma) MEAN FACTOR, UPPER RANGE, SAMPLE SIZE, A2 DA LOWER RANGE, D3 2 2 1.880 3.268

Table 1. Factors for Computing Control Chart
Table 1. Factors for Computing Control Chart Limits (3 sigma) MEAN FACTOR, UPPER RANGE, SAMPLE SIZE, A2 DA LOWER RANGE, D3 2 2 1.880 3.268 0.000 3 1.023 2.574 0.000 4 0.729 2.282 0.000 5 0.577 2.115 0.000 6 0.483 2.004 0.000 7 0.419 1.924 0.076 0.373 1864 0.136 9 0.337 1816 0.184 10 013 1.777 0.223 12 02266 1716 0.294 hp WEST 6. 8. 9 Table 2. Length of Bookmarks (inches) Observation Sample 1 Sample 2 Sample 3 Sample 4 Sample 5 Sample 6 1 9.6 9.9 9.8 9.3 9.5 9.3 2 9.5 9.7 9.6 9.4 9.1 9.5 3 9.4 9.4 9.1 9.5 9.1 9.7 4 9.2 9.7 9.8 9.7 9.4 9.7 5 9.2 9.3 9.5 9.4 9.5 9.5 6 9.8 9.9 9.7 2.7 9,4 9.9 7 9.7 9.9 9.8 98 9:22 9.8 8 9.1 9:5 9.3 9. 29 99 Average 9.4 9.7 9.6 9.5 924 97 Range hp Question 15 Based on Tables 1 and 2. which of the following statements is true for the R-chart? There are five or more sample ranges in a row above the mean. There are five or more sample ranges in a row below the mean There is at least two ranges in a row very close to the control chart limit. There are no patterns on the control chart There are five or more sample ranges in a row decreasing There are five or more sambio ranges in a row increasing, Question 16 Based on Tablet 1 and 2 bookmark length is stable and predictable thp

Step by Step Solution

There are 3 Steps involved in it

1 Expert Approved Answer
Step: 1 Unlock blur-text-image
Question Has Been Solved by an Expert!

Get step-by-step solutions from verified subject matter experts

Step: 2 Unlock
Step: 3 Unlock

Students Have Also Explored These Related General Management Questions!