

Question: Refer to Table S6 1 - Factors for Computing Control Chart Limits (3 skama) for this problem A process that is contidered to be in
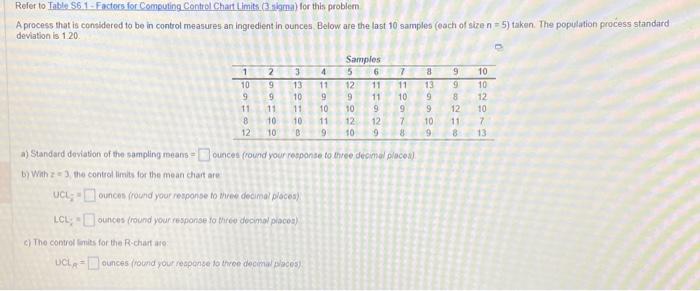
Refer to Table S6 1 - Factors for Computing Control Chart Limits (3 skama) for this problem A process that is contidered to be in control measures an ingredient in ounces. Below are the last 10 samples (each of slie n=5 ) taken. The population process standard deviation is 1.20 . a) Standard doviation of the sampling means = cunces (round your rosponse to whree decimal places) b) Whin z=3, the control limits for the mean chant are UCL- = ounces (round your response to three decimar places) LCL; = ounces (round your resporse to three docimal placea) c) The control lemits for the R-chart are DCHA= ounces (round your response to thice decimal isipces)
Step by Step Solution
There are 3 Steps involved in it

Get step-by-step solutions from verified subject matter experts