

Question: Refer to Table S6.1 - Factons for Computing Coatrol Chart Limits (3 sjgma) for this problem. Thirty-five samples of size 7 each were taken from
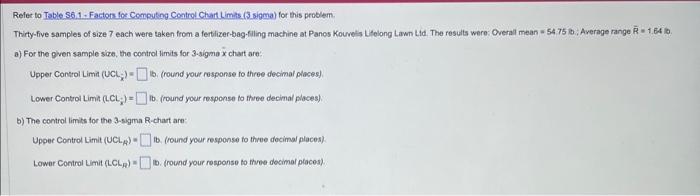
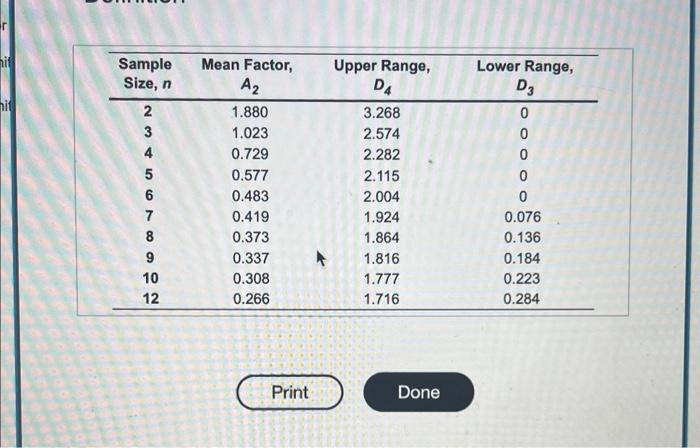
Refer to Table S6.1 - Factons for Computing Coatrol Chart Limits (3 sjgma) for this problem. Thirty-five samples of size 7 each were taken from a fertlizer-bag-filing machine at Panos Kouvels Lelong Lawn tid. The results were: Overal mean = 54.75 ib. Average range R = 1.64 io. a) For the given sample size, the control limits for 3-sigma x chart are: Upper Contol Limin (UCl1)= 16. (round your response to three decimal places). Lower Controi Limit (LCLj)= Ih. (round your response to thee decimal ploces): b) The control limits for the 3 sigma R-chart are- Upper Control Limit (UCLA) ) = th. (round your response to three docimal places). Lower Control Limit (LCl2)= 16. (round your response to thee decimal places) \begin{tabular}{cccc} \hline SampleSize,n & MeanFactor,A2 & UpperRange,D4 & LowerRange,D3 \\ \hline 2 & 1.880 & 3.268 & 0 \\ 3 & 1.023 & 2.574 & 0 \\ 4 & 0.729 & 2.282 & 0 \\ 5 & 0.577 & 2.115 & 0 \\ 6 & 0.483 & 2.004 & 0 \\ 7 & 0.419 & 1.924 & 0.076 \\ 8 & 0.373 & 1.864 & 0.136 \\ 9 & 0.337 & 1.816 & 0.184 \\ 10 & 0.308 & 1.777 & 0.223 \\ 12 & 0.266 & 1.716 & 0.284 \\ \hline \end{tabular}
Step by Step Solution
There are 3 Steps involved in it

Get step-by-step solutions from verified subject matter experts